Nice house with 3 bedrooms 2 bathrooms in a developing area. It has attached an efficiency that can also be rented.
For sale
$389,000
406 Foster Rd, Hallandale, FL 33009
3beds
1,053sqft
Single Family Residence
Built in 1958
3,750 Square Feet Lot
$-- Zestimate®
$369/sqft
$-- HOA
What's special
- 29 days
- 885
- 67
Likely to sell faster than
Zillow last checked:
Listing updated:
Listed by:
Hernando Ramirez 954-562-0366,
Global Investing Services
Source: MIAMI,MLS#: A12096772 Originating MLS: A-Miami Association of REALTORS
Facts & features
Interior
Bedrooms & bathrooms
- Bedrooms: 3
- Bathrooms: 2
- Full bathrooms: 2
Heating
- None
Cooling
- Wall/Window Unit(s)
Appliances
- Included: Dryer, Electric Range, Electric Water Heater, Refrigerator
Features
- Flooring: Ceramic Tile
Interior area
- Total structure area: 1,093
- Total interior livable area: 1,053 sqft
Video & virtual tour
Property
Parking
- Total spaces: 2
- Parking features: Driveway
- Garage spaces: 2
- Has uncovered spaces: Yes
Features
- Stories: 1
- Entry location: First Floor Entry
- Patio & porch: Deck
- Pool features: R30-No Pool/No Water
- Fencing: Fenced
- View description: None
Lot
- Size: 3,750 Square Feet
- Features: Less Than 1/4 Acre Lot
- Residential vegetation: Fruit Trees
Details
- Additional structures: Studio Apartment
- Parcel number: 514221150590
- Zoning: WEST RAC
Construction
Type & style
- Home type: SingleFamily
- Property subtype: Single Family Residence
Materials
- Other
- Roof: Other
Condition
- Year built: 1958
Utilities & green energy
- Sewer: Public Sewer
- Water: Municipal Water
Community & HOA
Community
- Features: None, No Subdiv/Park Info
- Subdivision: Foster Homesites
HOA
- Has HOA: No
Location
- Region: Hallandale
Financial & listing details
- Price per square foot: $369/sqft
- Tax assessed value: $422,500
- Annual tax amount: $9,093
- Date on market: 9/28/2026
- Listing terms: Conventional
Estimated market value
Not available
Estimated sales range
Not available
Not available
Price history
| Date | Event | Price |
|---|---|---|
| 10/14/2026 | Listed for rent | $2,500+143.9%$2/sqft |
Source:  MIAMI #A12106494 Report a problem | ||
| 9/28/2026 | Listed for sale | $389,000-8.3%$369/sqft |
Source: MIAMI #A12096772 Report a problem | ||
| 1/30/2026 | Listing removed | $1,025$1/sqft |
Source: MIAMI #A11942976 Report a problem | ||
| 1/14/2026 | Price change | $1,025+5.1%$1/sqft |
Source: MIAMI #A11942976 Report a problem | ||
| 1/13/2026 | Listed for rent | $975-63.2%$1/sqft |
Source: MIAMI #A11942976 Report a problem | ||
| 3/29/2025 | Listing removed | $2,650$3/sqft |
Source: Zillow Rentals Report a problem | ||
| 2/15/2025 | Price change | $2,650-1.5%$3/sqft |
Source: Zillow Rentals Report a problem | ||
| 2/13/2025 | Listed for rent | $2,690+124.2%$3/sqft |
Source: Zillow Rentals Report a problem | ||
| 11/13/2024 | Listing removed | $1,200$1/sqft |
Source: MIAMI #A11672478 Report a problem | ||
| 11/8/2024 | Price change | $1,200-7.7%$1/sqft |
Source: MIAMI #A11672478 Report a problem | ||
| 10/18/2024 | Price change | $1,300-3.7%$1/sqft |
Source: MIAMI #A11672478 Report a problem | ||
| 10/14/2024 | Price change | $1,350-20.6%$1/sqft |
Source: MIAMI #A11672478 Report a problem | ||
| 10/7/2024 | Listed for rent | $1,700-41.2%$2/sqft |
Source: MIAMI #A11672478 Report a problem | ||
| 1/19/2024 | Listing removed | -- |
Source: MIAMI #A11510037 Report a problem | ||
| 1/9/2024 | Price change | $2,890-9.7%$3/sqft |
Source: MIAMI #A11510037 Report a problem | ||
| 1/8/2024 | Listed for rent | $3,200+128.6%$3/sqft |
Source: MIAMI #A11510037 Report a problem | ||
| 12/27/2023 | Sold | $424,000-2.5%$403/sqft |
Source: Public Record Report a problem | ||
| 12/27/2023 | Listing removed | -- |
Source: MIAMI #A11501839 Report a problem | ||
| 12/16/2023 | Listed for rent | $1,400+7.7%$1/sqft |
Source: MIAMI #A11501839 Report a problem | ||
| 12/9/2023 | Listing removed | -- |
Source: MIAMI #A11495841 Report a problem | ||
| 12/5/2023 | Listed for rent | $1,300$1/sqft |
Source: MIAMI #A11495841 Report a problem | ||
| 12/3/2023 | Listed for sale | $434,900$413/sqft |
Source: MIAMI #A11488230 Report a problem | ||
| 11/21/2023 | Contingent | $434,900$413/sqft |
Source: MIAMI #A11488230 Report a problem | ||
| 11/17/2023 | Listed for sale | $434,900$413/sqft |
Source: MIAMI #A11488230 Report a problem | ||
| 4/25/2021 | Listing removed | -- |
Source: Zillow Rental Network_1 Report a problem | ||
Public tax history
| Year | Property taxes | Tax assessment |
|---|---|---|
| 2025 | $9,093 +9.9% | $398,770 +10% |
| 2024 | $8,273 +9.7% | $362,520 +12.4% |
| 2023 | $7,543 +47.6% | $322,400 +58.7% |
| 2022 | $5,111 +13.3% | $203,120 +10% |
| 2021 | $4,509 +11.5% | $184,660 +10% |
| 2020 | $4,043 +9.4% | $167,880 +10% |
| 2019 | $3,697 | $152,620 +3.4% |
| 2018 | $3,697 +36.8% | $147,560 +72.6% |
| 2017 | $2,703 +33.8% | $85,490 +10% |
| 2016 | $2,020 +6.1% | $77,720 +6.8% |
| 2015 | $1,903 +80.7% | $72,770 +103.4% |
| 2014 | $1,053 | $35,770 -38.3% |
| 2013 | $1,053 +41.6% | $57,960 +96% |
| 2012 | $744 +490.1% | $29,570 -7.5% |
| 2011 | $126 +0.8% | $31,970 +29.5% |
| 2010 | $125 | $24,680 +2.7% |
| 2009 | $125 +28.9% | $24,040 +0.1% |
| 2008 | $97 +7.8% | $24,020 +3% |
| 2007 | $90 +28.6% | $23,330 +2.5% |
| 2006 | $70 | $22,770 +3% |
| 2005 | -- | $22,110 +3% |
| 2004 | $70 | $21,470 +1.9% |
| 2003 | $70 +130.6% | $21,070 +2.4% |
| 2002 | $30 | $20,580 +1.6% |
| 2001 | $30 +9.3% | $20,260 |
| 2000 | $28 | -- |
Find assessor info on the county website
Monthly payment
Est. payment
Payment breakdown
Explore the cost of this home by adjusting the details. Changes won't be saved.Climate risks
Neighborhood: 33009


Similar homes
- $460,0003 bd1 ba1k sqftBritan Add Amended Plat, Hallandale, FL 33009For Sale

 MLS ID #A12074336, Mauricio Uribe, Vertical Int'l Real Estate. MIAMI
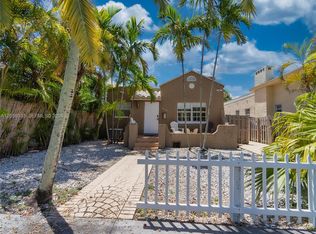
- $449,0003 bd1 ba1k sqftAtlantic Shores Dixie Hig, Hallandale, FL 33009For Sale
 MLS ID #A12059533, Yoel Lipszyc, Realty Hub. MIAMI
- $554,0003 bd2 ba1.2k sqftIngalls Tracts, Hallandale Beach, FL 33009For Sale
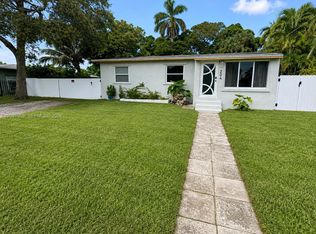 MLS ID #A12081966, Jessalyn Marrero, Empire Network Realty. MIAMI
- $449,9903 bd2 ba1.2k sqftWyn Homesites No 3, Miramar, FL 33023For Sale
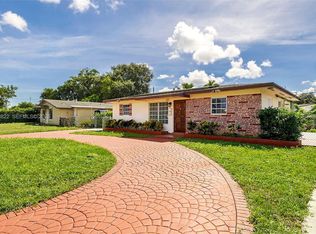 MLS ID #A12108822, Melchire Stville, Kariza Capital Realty, LLC. MIAMI
- $420,0003 bd2 ba1.1k sqftHollywood Beach Heights S, Hollywood, FL 33021For SaleMLS ID #A11942925, David Stocker JR., STB Realty. MIAMI
- $499,0003 bd2 ba1k sqftHollywood Little Ranches, Hollywood, FL 33020For SaleMLS ID #A12079313, Raymond Chirino, One Sotheby's International Realty. MIAMI
- $279,9002 bd2 ba1k sqftMeadowbrook Towers Condo, Hallandale Beach, FL 33009For SaleMLS ID #A12056973, Taylana Izrailov, Core Realty Associates, Inc.. MIAMI
- $300,0003 bd2 ba864 sqftCollege Tract, Dania, FL 33004For SaleMLS ID #A12017868, Waldo Fuentes Concepcin, SF Realty Advisors, LLC.. MIAMI
- $449,9002 bd1 ba841 sqftOcean Breeze Gardens Resu, Hollywood, FL 33020For SaleMLS ID #A12073899, Sorty Mejia, LoKation. MIAMI
- $385,9002 bd3 ba1k sqftSouthport Square Condo, Fort Lauderdale, FL 33316For SaleMLS ID #A12092402, Clementina Calvo Sitges, United Realty Group Inc. MIAMI
- $520,0002 bd1 ba1.4k sqft1070 NE 143RD Street, North Miami, FL 33161For Sale
 MLS ID #B26092864, Marina Alemann, Premier Investments Realty. BeachesMLS
- $390,0002 bd2 ba1k sqft2294 NW 81ST Terrace, Sunrise, FL 33322For SaleMLS ID #B26076665, Vanessa Suarez Estrada, Lukso Realty LLC. BeachesMLS
- $409,9003 bd2 ba1.1k sqft11700 SW 19th Street, Miramar, FL 33025For SaleMLS ID #B26084601, Brad K Tillem, Progressive Florida Realty Inc. BeachesMLS
- $430,0004 bd2 ba1.2k sqftLarkdale Unit 4, Fort Lauderdale, FL 33311For SaleMLS ID #A12083573, Carlos Prieto, Realty Hub. MIAMI
- $543,0004 bd2 ba1.1k sqftWilkes-Barre Park, Hollywood, FL 33020For SaleMLS ID #A12075119, Alexandra Jordan, Bellisimo Realty, LLC. MIAMI
- $434,9002 bd1 ba884 sqftDriftwood Acres No 6, Hollywood, FL 33024For SaleMLS ID #A12064277, Raul Lopez, LPT Realty, LLC. MIAMI
- $429,9993 bd2 ba1.1k sqftJohn F Kennedy Estates Se, Fort Lauderdale, FL 33311For SaleMLS ID #A12014067, Johnjon Gonzalez, Luxe Properties. MIAMI
- $399,0003 bd2 ba1.2k sqftMainlands Of Tamarac Lake, Tamarac, FL 33321For SaleMLS ID #A12058861, Janeth Silva PA, United Realty Group Inc. MIAMI
- $375,0002 bd1 ba878 sqftRiverside Park Add Amen P, Fort Lauderdale, FL 33312For SaleMLS ID #A11706391, Patty Da Silva, Green Realty Properties Inc.. MIAMI
- $345,0003 bd3 ba952 sqftShore Villas Condominuim, Miami, FL 33138For SaleMLS ID #A12112574, Manuela Nieto, Miami Beach Real Estate Group. MIAMI
