$220,600
-- bd|1 ba|1k sqft
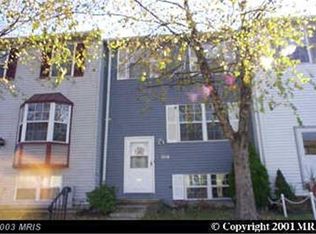
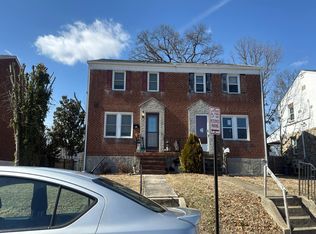
4063 Rustico Rd, Baltimore, MD 21220
Off Market
Zillow last checked: 8 hours ago
Listing updated: 21 hours ago
Brittany Swain 443-928-1299,
Northrop Realty 4439213900
$259,300
$246,000 - $272,000
$2,218/mo
| Date | Event | Price |
|---|---|---|
| 1/14/2020 | Sold | $174,900$116/sqft |
Source: Public Record Report a problem | ||
| 11/13/2019 | Pending sale | $174,900$116/sqft |
Source: Signature Realty Group, LLC #MDBC478028 Report a problem | ||
| 11/9/2019 | Listed for sale | $174,900+66.6%$116/sqft |
Source: Signature Realty Group, LLC #MDBC478028 Report a problem | ||
| 10/13/2017 | Sold | $105,000+11.7%$70/sqft |
Source: Public Record Report a problem | ||
| 6/2/2017 | Listing removed | $94,000$63/sqft |
Source: Bay View Realty #BC9889846 Report a problem | ||
| 6/2/2017 | Listed for sale | $94,000$63/sqft |
Source: Bay View Realty #BC9889846 Report a problem | ||
| 6/2/2017 | Pending sale | $94,000$63/sqft |
Source: Bay View Realty #BC9889846 Report a problem | ||
| 5/24/2017 | Listed for sale | $94,000$63/sqft |
Source: Bay View Realty #BC9889846 Report a problem | ||
| 3/30/2017 | Listing removed | $94,000$63/sqft |
Source: Bay View Realty #BC9889846 Report a problem | ||
| 3/17/2017 | Listed for sale | $94,000-21.9%$63/sqft |
Source: Bay View Realty #BC9889846 Report a problem | ||
| 4/29/2016 | Sold | $120,400+381.6%$80/sqft |
Source: Public Record Report a problem | ||
| 4/5/2016 | Price change | $25,000+25%$17/sqft |
Source: Auction.com Report a problem | ||
| 1/6/2016 | Price change | $20,000-88.9%$13/sqft |
Source: Auction.com Report a problem | ||
| 10/28/2015 | Listed for sale | -- |
Source: Auction.com Report a problem | ||
| 11/7/2005 | Sold | $180,500+107.7%$120/sqft |
Source: Public Record Report a problem | ||
| 6/8/1999 | Sold | $86,900$58/sqft |
Source: Public Record Report a problem | ||
| Year | Property taxes | Tax assessment |
|---|---|---|
| 2025 | $3,605 +57.7% | $204,433 +8.4% |
| 2024 | $2,285 +9.2% | $188,567 +9.2% |
| 2023 | $2,093 +4.8% | $172,700 |
| 2022 | $1,997 +5.1% | $172,700 +10.2% |
| 2021 | $1,900 +5.4% | $156,767 +5.4% |
| 2020 | $1,803 +2.6% | $148,800 |
| 2019 | $1,758 +2.6% | $148,800 +5.3% |
| 2018 | $1,713 +2.7% | $141,333 +2.7% |
| 2017 | $1,668 -27.9% | $137,600 +0.9% |
| 2016 | $2,312 | $136,333 +0.9% |
| 2015 | $2,312 | $135,067 +0.9% |
| 2014 | $2,312 | $133,800 |
| 2013 | -- | $133,800 |
| 2012 | -- | $133,800 -24.3% |
| 2011 | -- | $176,800 +2.3% |
| 2010 | -- | $172,890 +2.3% |
| 2009 | -- | $168,930 +2.4% |
| 2008 | -- | $164,970 +17.7% |
| 2007 | -- | $140,202 +21.5% |
| 2006 | -- | $115,436 +27.3% |
| 2005 | -- | $90,670 +3.9% |
| 2004 | -- | $87,282 +4% |
| 2003 | -- | $83,896 +4.2% |
| 2002 | -- | $80,510 +0.6% |
| 2001 | -- | $79,992 |
Find assessor info on the county website
Source: Bright MLS. This data may not be complete. We recommend contacting the local school district to confirm school assignments for this home.