Come see this updated 2 bedroom, 1.75 bath home offering approximately 837 sq ft of living space! Recent updates include a new automatic gate opener, a new boiler, and a new electrical panel. The property also features updated flooring throughout, concrete surrounding the home, and an additional storage room on the side of the house. For added security, the home includes an alarm system and a metal carport for covered parking. Call today to schedule your showing and take the first step toward making this lovely home yours!
Active
$259,999
407 Decatur St, Bakersfield, CA 93308
2beds
2baths
662sqft
Single Family Residence
Built in 1931
6,233 Square Feet Lot
$247,800 Zestimate®
$393/sqft
$-- HOA
What's special
Updated flooring throughoutAlarm system
- 16 hours
- 122
- 14
Zillow last checked:
Listing updated:
Listed by:
Sandra Oropeza DRE #01976278 661-619-2308 sandy.searchkern@gmail.com,
SearchKern.com
Source: Bakersfield AOR,MLS#: 202611405
Facts & features
Interior
Bedrooms & bathrooms
- Bedrooms: 2
- Bathrooms: 2
Heating
- Central
Cooling
- Central Air
Features
- Has fireplace: No
Interior area
- Total structure area: 662
- Total interior livable area: 662 sqft
Property
Parking
- Parking features: Carport
- Has carport: Yes
Features
- Levels: One
- Stories: 1
- Pool features: None
Lot
- Size: 6,233 Square Feet
Details
- Parcel number: 11331206
- Zoning: R2
- Zoning description: R2
- Special conditions: Standard
Construction
Type & style
- Home type: SingleFamily
- Property subtype: Single Family Residence
Condition
- Year built: 1931
Community & HOA
Community
- Subdivision: W J Dickinson Subdivision
Location
- Region: Bakersfield
Financial & listing details
- Price per square foot: $393/sqft
- Tax assessed value: $243,453
- Date on market: 10/29/2026
Estimated market value
$247,800
$233,000 - $260,000
$1,371/mo
Price history
| Date | Event | Price |
|---|---|---|
| 10/29/2026 | Listed for sale | $259,999+4%$393/sqft |
Source:  Bakersfield AOR #202611405 Report a problem | ||
| 3/25/2024 | Pending sale | $250,000+6.8%$378/sqft |
Source: Bakersfield AOR #202400208 Report a problem | ||
| 3/21/2024 | Sold | $234,000-6.4%$353/sqft |
Source: Bakersfield AOR #202400208 Report a problem | ||
| 1/25/2024 | Price change | $250,000-3.8%$378/sqft |
Source: Bakersfield AOR #202400208 Report a problem | ||
| 1/4/2024 | Listed for sale | $260,000+145.3%$393/sqft |
Source: Bakersfield AOR #202400208 Report a problem | ||
| 3/24/2021 | Listing removed | -- |
Source: Owner Report a problem | ||
| 8/14/2019 | Sold | $106,000-8.6%$160/sqft |
Source: Public Record Report a problem | ||
| 7/11/2019 | Listed for sale | $116,000$175/sqft |
Source: Owner Report a problem | ||
| 2/1/2019 | Listing removed | $116,000$175/sqft |
Source: Capitol Real Estate Group, Inc #21812954 Report a problem | ||
| 12/18/2018 | Listed for sale | $116,000$175/sqft |
Source: Capitol Real Estate Group, Inc #21812954 Report a problem | ||
| 11/7/2018 | Listing removed | $116,000$175/sqft |
Source: Capitol Real Estate Group, Inc #21812954 Report a problem | ||
| 10/27/2018 | Price change | $116,000-2.9%$175/sqft |
Source: Capitol Real Estate Group, Inc #21812954 Report a problem | ||
| 10/6/2018 | Price change | $119,500-2%$181/sqft |
Source: Capitol Real Estate Group, Inc #21812954 Report a problem | ||
| 9/8/2018 | Listed for sale | $122,000+238.9%$184/sqft |
Source: Capitol Real Estate Group, Inc #21812954 Report a problem | ||
| 7/2/2018 | Sold | $36,000$54/sqft |
Source: Bakersfield AOR #21806630 Report a problem | ||
Public tax history
| Year | Property taxes | Tax assessment |
|---|---|---|
| 2026 | -- | $243,453 +2% |
| 2025 | $3,831 +62.2% | $238,680 +110% |
| 2024 | $2,362 +3.6% | $113,649 +2% |
| 2023 | $2,281 +3.7% | $111,422 +2% |
| 2022 | $2,199 | $109,238 +2% |
| 2021 | -- | $107,097 +1% |
| 2020 | -- | $106,000 +121.1% |
| 2019 | $1,295 +29.2% | $47,940 +45.7% |
| 2018 | $1,002 +2.1% | $32,892 +2% |
| 2017 | $982 +5.4% | $32,248 +2% |
| 2016 | $931 +1.3% | $31,616 +1.5% |
| 2015 | $919 +0.3% | $31,142 +2% |
| 2014 | $917 | $30,533 +0.5% |
| 2013 | -- | $30,396 +2% |
| 2012 | $849 +0.5% | $29,801 +2% |
| 2011 | $845 +41.1% | $29,217 +116.3% |
| 2010 | $599 +0.4% | $13,510 -0.3% |
| 2009 | $596 +2.4% | $13,544 +2% |
| 2008 | $583 +3.2% | $13,280 +2% |
| 2007 | $564 +17.1% | $13,020 +2% |
| 2006 | $482 +4.8% | $12,766 +2% |
| 2005 | $460 +1.6% | $12,516 |
| 2004 | $453 +10.5% | $12,516 +1.9% |
| 2003 | $410 | $12,288 +4% |
| 2002 | $410 +1.3% | $11,812 +2% |
| 2001 | $404 | $11,582 |
| 2000 | -- | $11,582 |
Find assessor info on the county website
Monthly payment
Est. payment
Payment breakdown
Explore the cost of this home by adjusting the details. Changes won't be saved.Climate risks
Neighborhood: Oildale
Nearby schools
Schools provided by the listing agent
- Elementary: Wingland
- Middle: Standard
- High: North
Source: Bakersfield AOR. This data may not be complete. We recommend contacting the local school district to confirm school assignments for this home.


Similar homes
- $259,9992 bd1 ba650 sqft608 Belle Ave, Bakersfield, CA 93308For Sale
 MLS ID #202602344, Roger V. Magana. Bakersfield AOR
- $259,9993 bd2 ba888 sqft300 Beardsley Ave, Bakersfield, CA 93308For Sale
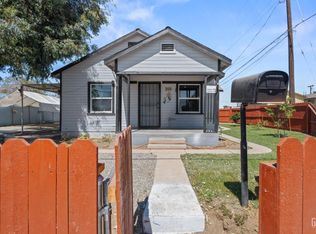 MLS ID #202609452, Vanessa Camacho. Bakersfield AOR
- $225,0002 bd1 ba672 sqft429 Wilson Ave, Bakersfield, CA 93308For Sale
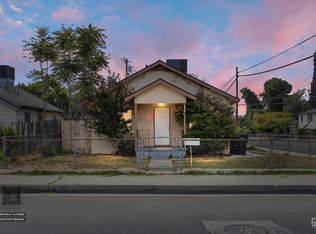 MLS ID #202610493, George H. Hernandez. Bakersfield AOR
- $238,9992 bd1 ba780 sqft1001 Wilson Ave, Bakersfield, CA 93308For Sale
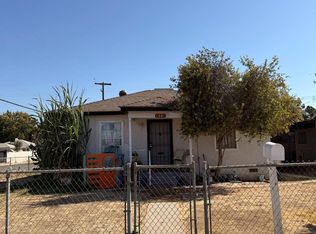 MLS ID #202609414, Maria L. Lopez. Bakersfield AOR
