$402,800
-- bd|-- ba|1.7k sqft
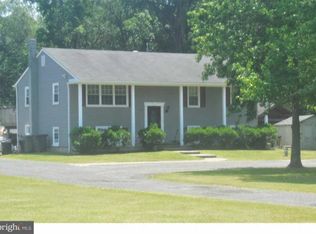
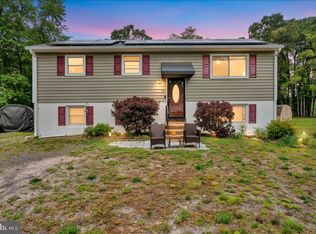
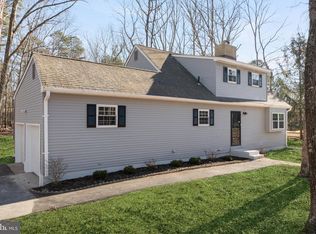
406 Burrs Mill Rd, Southampton, NJ 08088
Off Market
Zillow last checked:
Listing updated:
Chris Twardy 609-304-2314,
BHHS Fox & Roach-Mt Laurel,
Listing Team: Tri State Real Estate Group
Not available
Estimated sales range
Not available
Not available
| Date | Event | Price |
|---|---|---|
| 4/11/2019 | Sold | $225,000$130/sqft |
Source: Public Record Report a problem | ||
| 1/25/2019 | Sold | $225,000-2.1%$130/sqft |
Source: Agent Provided Report a problem | ||
| 10/12/2018 | Pending sale | $229,900$133/sqft |
Source: BHHS Fox & Roach - Moorestown #1003261430 Report a problem | ||
| 8/23/2018 | Price change | $229,900-1.3%$133/sqft |
Source: BHHS Fox & Roach - Moorestown #1003261430 Report a problem | ||
| 8/14/2018 | Price change | $232,900-0.9%$134/sqft |
Source: BHHS Fox & Roach - Moorestown #1003261430 Report a problem | ||
| 8/7/2018 | Price change | $234,900-1.1%$136/sqft |
Source: BHHS Fox & Roach - Moorestown #1003261430 Report a problem | ||
| 5/18/2018 | Price change | $237,500-1%$137/sqft |
Source: BHHS Fox & Roach-Moorestown #7139317 Report a problem | ||
| 5/2/2018 | Price change | $239,900-1.1%$139/sqft |
Source: BHHS Fox & Roach-Moorestown #7139317 Report a problem | ||
| 4/23/2018 | Price change | $242,500-3%$140/sqft |
Source: BHHS Fox & Roach-Moorestown #7139317 Report a problem | ||
| 3/8/2018 | Listed for sale | $249,900+108.3%$144/sqft |
Source: Bhhs Fox & Roach-Moorestown #1000242672 Report a problem | ||
| 12/5/2017 | Sold | $120,000$69/sqft |
Source: Public Record Report a problem | ||
| Year | Property taxes | Tax assessment |
|---|---|---|
| 2025 | $7,037 +3.8% | $213,300 |
| 2024 | $6,777 | $213,300 |
| 2023 | -- | $213,300 |
| 2022 | $6,538 +2.2% | $213,300 |
| 2021 | $6,395 +4.5% | $213,300 |
| 2020 | $6,120 +2.4% | $213,300 |
| 2019 | $5,977 -0.4% | $213,300 |
| 2018 | $5,998 +2.2% | $213,300 |
| 2017 | $5,870 +3.3% | $213,300 |
| 2016 | $5,684 +3.7% | $213,300 |
| 2015 | $5,484 +2.6% | $213,300 |
| 2014 | $5,345 +0.2% | $213,300 |
| 2013 | $5,333 +0.5% | $213,300 |
| 2012 | $5,308 -0.4% | $213,300 +34.7% |
| 2011 | $5,332 +1.9% | $158,400 |
| 2010 | $5,234 +1% | $158,400 |
| 2009 | $5,180 +1% | $158,400 |
| 2008 | $5,131 +1.6% | $158,400 |
| 2007 | $5,051 +6.1% | $158,400 |
| 2006 | $4,760 +8.1% | $158,400 |
| 2005 | $4,404 +8.3% | $158,400 |
| 2004 | $4,068 | $158,400 |
| 2003 | -- | $158,400 +53.6% |
| 2002 | -- | $103,100 |
| 2001 | -- | $103,100 |
Find assessor info on the county website
Source: Bright MLS. This data may not be complete. We recommend contacting the local school district to confirm school assignments for this home.
A local agent can set up tours, give advice and negotiate with sellers.