Welcome to 41 Prospect Street! This charming 3-bedroom, 1-bath condex occupies the right side of a classic 1910 Colonial in Georgetown, Massachusetts. Offering approximately 1,322 square feet of living space, the home blends timeless character with everyday comfort. Beautiful hardwood floors add warmth and complement the home’s traditional charm, while three bedrooms offer flexibility for sleeping space, a home office, or hobbies. Schedule your private showing today to get a feel for everything this property has to offer.
For sale
$469,900
41 Prospect St Unit 41, Georgetown, MA 01833
3beds
1,322sqft
Condominium, Townhouse
Built in 1910
-- sqft lot
$469,800 Zestimate®
$355/sqft
$-- HOA
What's special
Beautiful hardwood floors
- 15 days
- 927
- 91
Likely to sell faster than
Zillow last checked:
Listing updated:
Listed by:
Joshua Winn 603-391-5503,
Realty One Group Next Level 888-888-7653
Source: MLS PIN,MLS#: 73590560
Facts & features
Interior
Bedrooms & bathrooms
- Bedrooms: 3
- Bathrooms: 1
- Full bathrooms: 1
Primary bedroom
- Level: Second
Bedroom 2
- Level: Second
Bedroom 3
- Level: Third
Dining room
- Level: First
Kitchen
- Level: First
Living room
- Level: First
Heating
- Forced Air, Oil
Cooling
- None
Features
- Has basement: Yes
- Has fireplace: No
- Common walls with other units/homes: End Unit
Interior area
- Total structure area: 1,322
- Total interior livable area: 1,322 sqft
- Finished area above ground: 1,322
Property
Parking
- Total spaces: 4
- Parking features: Detached, Paved
- Garage spaces: 1
- Uncovered spaces: 3
Details
- Parcel number: M:0011A B:0018 L:0041,4284489
- Zoning: RA
Construction
Type & style
- Home type: Townhouse
- Property subtype: Condominium, Townhouse
- Attached to another structure: Yes
Condition
- Year built: 1910
Utilities & green energy
- Electric: 100 Amp Service
- Sewer: Public Sewer, Private Sewer
- Water: Public
Community & HOA
Location
- Region: Georgetown
Financial & listing details
- Price per square foot: $355/sqft
- Tax assessed value: $400,900
- Annual tax amount: $5,516
- Date on market: 10/14/2026
Estimated market value
$469,800
$446,000 - $493,000
$2,734/mo
Price history
| Date | Event | Price |
|---|---|---|
| 10/14/2026 | Listed for sale | $469,900+22.1%$355/sqft |
Source: MLS PIN #73590560 Report a problem | ||
| 7/1/2021 | Sold | $385,000-1.3%$291/sqft |
Source: Public Record Report a problem | ||
| 3/18/2020 | Listing removed | $389,900$295/sqft |
Source: Bentley's #72630895 Report a problem | ||
| 3/7/2020 | Listed for sale | $389,900+16%$295/sqft |
Source: Bentley's #72630895 Report a problem | ||
| 2/28/2020 | Listing removed | $2,500$2/sqft |
Source: Owner Report a problem | ||
| 1/31/2020 | Listed for rent | $2,500+4.2%$2/sqft |
Source: Owner Report a problem | ||
| 6/1/2019 | Listing removed | $2,400$2/sqft |
Source: Owner Report a problem | ||
| 5/11/2019 | Listed for rent | $2,400$2/sqft |
Source: Owner Report a problem | ||
| 5/11/2018 | Sold | $336,000+40%$254/sqft |
Source: Public Record Report a problem | ||
| 2/18/2005 | Sold | $240,000+20.6%$182/sqft |
Source: Public Record Report a problem | ||
| 4/17/2002 | Sold | $199,000$151/sqft |
Source: Public Record Report a problem | ||
Public tax history
| Year | Property taxes | Tax assessment |
|---|---|---|
| 2025 | $4,434 -9.2% | $400,900 +3% |
| 2024 | $4,883 -0.9% | $389,100 +2.5% |
| 2023 | $4,927 | $379,600 |
| 2022 | $4,927 -6.2% | $379,600 +14.8% |
| 2021 | $5,255 -0.2% | $330,700 |
| 2020 | $5,265 +28.3% | $330,700 +27.2% |
| 2019 | $4,103 +50.6% | $260,000 +51.5% |
| 2018 | $2,725 -1.8% | $171,600 +0.3% |
| 2017 | $2,774 -10.1% | $171,100 -11.9% |
| 2016 | $3,084 -11.6% | $194,300 -10.7% |
| 2015 | $3,487 +14.1% | $217,500 |
| 2014 | $3,056 -0.7% | $217,500 -4.2% |
| 2013 | $3,077 +3.5% | $227,100 |
| 2012 | $2,973 +12.2% | $227,100 |
| 2011 | $2,650 +10.3% | $227,100 |
| 2010 | $2,403 +8.3% | $227,100 +2.2% |
| 2009 | $2,219 +7.4% | $222,300 |
| 2008 | $2,067 -0.2% | $222,300 -2.9% |
| 2007 | $2,072 +3% | $229,000 +4.5% |
| 2006 | $2,012 +34% | $219,200 +32.4% |
| 2005 | $1,501 +1.3% | $165,500 +8.9% |
| 2004 | $1,482 -37.4% | $152,000 -19.1% |
| 2003 | $2,366 -8.8% | $187,800 -12.4% |
| 2001 | $2,594 +1.1% | $214,400 +26.5% |
| 2000 | $2,566 +3.9% | $169,500 +2.2% |
| 1997 | $2,469 | $165,800 |
Find assessor info on the county website
Monthly payment
Est. payment
Payment breakdown
Explore the cost of this home by adjusting the details. Changes won't be saved.Climate risks
Neighborhood: 01833
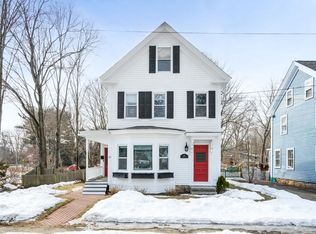
Similar homes
- $469,9003 bd1 ba1.4k sqft120 Groveland St, Haverhill, MA 01830For Sale
 MLS ID #73596018, Tony Rocca, Keller Williams Realty Boston Northwest. MLS PIN
- $699,9003 bd2 ba1.2k sqft83 Thurlow St, Georgetown, MA 01833For Sale
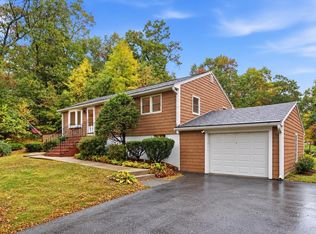 MLS ID #73592539, The Lopes Group, J. Barrett & Company. MLS PIN
- $499,9003 bd1 ba1.2k sqft18 Lanen Ave, Groveland, MA 01834For Sale
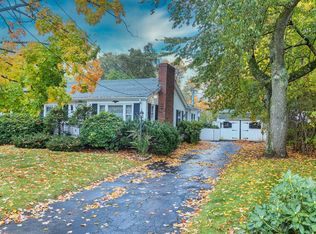 MLS ID #73592891, Vivien Marcus, Keller Williams Realty. MLS PIN
- $275,0002 bd1 ba1.2k sqft78 E Main St, Georgetown, MA 01833For Sale
 MLS ID #73561924, Steven DeFrancesco, Silverstone Realty Group. MLS PIN
