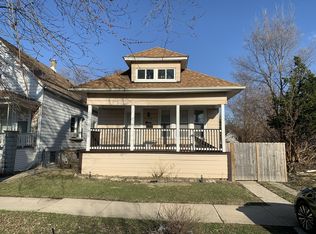
This 1980 square foot single family home has 4 bedrooms and 3.0 bathrooms. This home is located at 10639 S Forest Ave, Chicago, IL 60628.
Foreclosed
Est. $267,400
10639 S Forest Ave, Chicago, IL 60628
4beds
1,980sqft
SingleFamily
Built in 1938
3,750 Square Feet Lot
$267,400 Zestimate®
$135/sqft
$-- HOA
Overview
- 199 days |
- 19 |
- 0 |
Facts & features
Interior
Bedrooms & bathrooms
- Bedrooms: 4
- Bathrooms: 3
- Full bathrooms: 3
Heating
- Forced air, Gas
Cooling
- Central
Features
- Flooring: Hardwood, Laminate
- Basement: Finished
Interior area
- Total interior livable area: 1,980 sqft
Property
Parking
- Total spaces: 2
- Parking features: Garage - Detached
Features
- Exterior features: Brick
Lot
- Size: 3,750 Square Feet
Details
- Parcel number: 2515128013
Construction
Type & style
- Home type: SingleFamily
Materials
- Roof: Asphalt
Condition
- Year built: 1938
Utilities & green energy
- Sewer: Sewer-Public
Community & HOA
Location
- Region: Chicago
Financial & listing details
- Price per square foot: $135/sqft
- Tax assessed value: $140,000
- Annual tax amount: $2,961
Visit our professional directory to find a foreclosure specialist in your area that can help with your home search.
Find a foreclosure agentForeclosure details
Estimated market value
$267,400
$243,000 - $291,000
$2,702/mo
Price history
Price history
| Date | Event | Price |
|---|---|---|
| 4/17/2020 | Sold | $185,000-11.9%$93/sqft |
Source: | ||
| 3/15/2020 | Pending sale | $209,900$106/sqft |
Source: Padscouts Inc. #10638882 Report a problem | ||
| 2/28/2020 | Price change | $209,900-2.3%$106/sqft |
Source: Padscouts Inc. #10638882 Report a problem | ||
| 2/17/2020 | Price change | $214,900+7.4%$109/sqft |
Source: Padscouts Inc. #10638882 Report a problem | ||
| 1/7/2020 | Pending sale | $200,000$101/sqft |
Source: Padscouts Inc. #10599785 Report a problem | ||
| 11/27/2019 | Price change | $200,000-4.7%$101/sqft |
Source: Padscouts Inc. #10582665 Report a problem | ||
| 11/13/2019 | Price change | $209,900-4.5%$106/sqft |
Source: Padscouts Inc. #10572777 Report a problem | ||
| 11/7/2019 | Listed for sale | $219,900+443%$111/sqft |
Source: Padscouts Inc. #10572777 Report a problem | ||
| 7/16/2019 | Sold | $40,500-4.7%$20/sqft |
Source: | ||
| 7/16/2019 | Listed for sale | $42,500$21/sqft |
Source: Homesmart Connect LLC #10112975 Report a problem | ||
| 3/25/2019 | Pending sale | $42,500$21/sqft |
Source: Homesmart Connect LLC #10112975 Report a problem | ||
| 3/22/2019 | Price change | $42,500-22.7%$21/sqft |
Source: Homesmart Connect LLC #10112975 Report a problem | ||
| 11/26/2018 | Pending sale | $55,000$28/sqft |
Source: Homesmart Connect LLC #10112975 Report a problem | ||
| 10/16/2018 | Listed for sale | $55,000-54.2%$28/sqft |
Source: Homesmart Connect LLC #10112975 Report a problem | ||
| 1/5/1999 | Sold | $120,000$61/sqft |
Source: Public Record Report a problem | ||
Public tax history
Public tax history
| Year | Property taxes | Tax assessment |
|---|---|---|
| 2023 | $2,961 +2.5% | $14,000 |
| 2022 | $2,888 +2.3% | $14,000 |
| 2021 | $2,823 +12.9% | $14,000 +25% |
| 2020 | $2,501 +37.7% | $11,201 -10% |
| 2019 | $1,816 +1.8% | $12,446 |
| 2018 | $1,784 -7.8% | $12,446 +0.8% |
| 2017 | $1,935 -2.1% | $12,342 |
| 2016 | $1,977 +10.7% | $12,342 |
| 2015 | $1,785 +4.5% | $12,342 +5% |
| 2014 | $1,709 +2.7% | $11,754 |
| 2013 | $1,663 -0.1% | $11,754 |
| 2012 | $1,665 -9.9% | $11,754 -19.6% |
| 2011 | $1,848 +16.1% | $14,612 |
| 2010 | $1,592 +16.3% | $14,612 |
| 2009 | $1,369 +2.8% | $14,612 +2.3% |
| 2008 | $1,331 +3.3% | $14,277 |
| 2007 | $1,289 +0.8% | $14,277 |
| 2006 | $1,279 -5.2% | $14,277 +22.5% |
| 2005 | $1,349 +1.9% | $11,654 |
| 2004 | $1,324 +4.4% | $11,654 |
| 2003 | $1,268 -5.4% | $11,654 +25.7% |
| 2002 | $1,340 +6.6% | $9,269 |
| 2001 | $1,257 +1% | $9,269 |
| 2000 | $1,244 -24.1% | $9,269 +9.5% |
| 1999 | $1,640 | $8,465 |
Find assessor info on the county website
Monthly payment
Estimated monthly payment
All calculations are estimates and provided by Zillow, Inc. for informational purposes only. Actual amounts may vary.
HOA fees may include property taxes on listings classified as Co-Ops. Contact the listing agent and/or owner for fee details.
Mortgage interest rates are dependent on a number of factors, including credit score, down payment, and repayment length. Interest rate data provided by Zillow Group Marketplace, Inc. as of 1/1/1970 from various mortgage lenders with which we have lead or other similar arrangements; the Estimated Payment is an average of those rates.
See how much you could borrow to make a competitive offer.
Climate risks
Neighborhood: Rosemoor
Nearby schools
GreatSchools rating
- 5/10Cullen Elementary SchoolGrades: K-8Distance: 0.2 mi
- 1/10Corliss High SchoolGrades: 9-12Distance: 0.8 mi
- Illinois
- Cook County
- Chicago
- 60628
- Rosemoor
- 10639 S Forest Ave
Nearby cities
Nearby neighborhoods
Nearby zip codes
Other Chicago Topics
