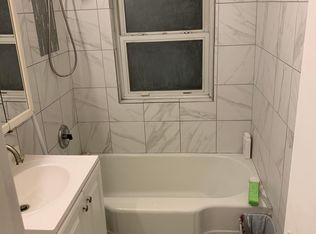
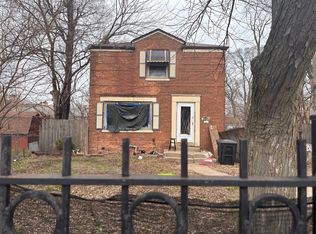
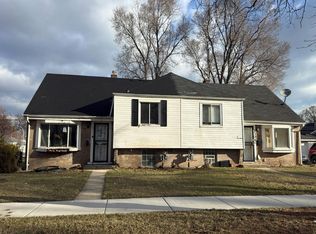
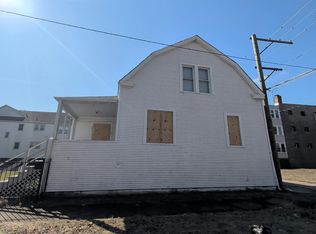
MUST SEE!! This beautiful all brick townhome (no HOA) is perfect for the first time buyer or investor looking for rental income (Voucher Approved). Featuring 2 bedrooms & 2 full baths (lower level family room could be 3rd bedroom/master suite), spacious eat-in kitchen, and separate laundry room and storage. All appliances included! Gorgeous hardwood floors and freshly painted neutral palette throughout. Huge backyard with a privacy fence, perfect for outside entertaining. Being sold AS IS, but in pristine condition for FHA financing, Home Warranty offered. Easy to show, make your appointment today. MOVE-IN READY!!
Foreclosed
Est. $137,700
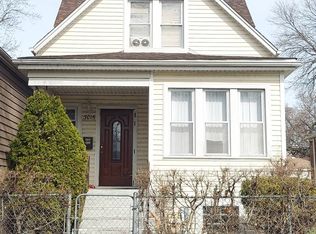
9657 S Yates Blvd, Chicago, IL 60617
2beds
2baths
1,200sqft
Condo
Built in 1947
-- sqft lot
$137,700 Zestimate®
$115/sqft
$-- HOA
Overview
- 240 days |
- 56 |
- 0 |
Facts & features
Interior
Bedrooms & bathrooms
- Bedrooms: 2
- Bathrooms: 2
Heating
- Forced air, Gas
Cooling
- Central
Appliances
- Included: Dishwasher, Microwave, Refrigerator
Features
- Flooring: Tile, Hardwood, Slate
- Basement: Finished
Interior area
- Total interior livable area: 1,200 sqft
Property
Parking
- Parking features: None
Features
- Exterior features: Brick
Lot
- Size: 3,750 Square Feet
Details
- Parcel number: 2607113058
Construction
Type & style
- Home type: Condo
Materials
- Roof: Asphalt
Condition
- Year built: 1947
Utilities & green energy
- Sewer: Sewer-Public
Community & HOA
Location
- Region: Chicago
Financial & listing details
- Price per square foot: $115/sqft
- Tax assessed value: $64,990
- Annual tax amount: $1,375
Visit our professional directory to find a foreclosure specialist in your area that can help with your home search.
Find a foreclosure agentForeclosure details
Estimated market value
$137,700
$124,000 - $151,000
$1,894/mo
Price history
Price history
| Date | Event | Price |
|---|---|---|
| 3/15/2021 | Sold | $109,000+10.1%$91/sqft |
Source: | ||
| 1/27/2021 | Pending sale | $99,000$83/sqft |
Source: | ||
| 1/12/2021 | Contingent | $99,000$83/sqft |
Source: | ||
| 1/12/2021 | Pending sale | $99,000$83/sqft |
Source: HomeSmart Realty Group #10967245 Report a problem | ||
| 1/9/2021 | Listed for sale | $99,000+4.3%$83/sqft |
Source: | ||
| 2/1/2018 | Listing removed | $94,900$79/sqft |
Source: Keller Williams Preferred Realty #09823207 Report a problem | ||
| 12/30/2017 | Listed for sale | $94,900-5%$79/sqft |
Source: Keller Williams Preferred Realty #09823207 Report a problem | ||
| 4/9/2010 | Sold | $99,900+544.5%$83/sqft |
Source: | ||
| 10/6/2009 | Sold | $15,500-81.8%$13/sqft |
Source: Public Record Report a problem | ||
| 12/23/2003 | Sold | $85,000$71/sqft |
Source: Public Record Report a problem | ||
Public tax history
Public tax history
| Year | Property taxes | Tax assessment |
|---|---|---|
| 2023 | $1,375 +2.5% | $6,499 |
| 2022 | $1,341 +109.8% | $6,499 |
| 2021 | $639 -30.8% | $6,499 -10.2% |
| 2020 | $924 -0.6% | $7,238 -10% |
| 2019 | $929 +1.9% | $8,043 |
| 2018 | $912 +1.5% | $8,043 +6.7% |
| 2017 | $899 -40.6% | $7,540 |
| 2016 | $1,514 +9.3% | $7,540 |
| 2015 | $1,385 +7.7% | $7,540 +9% |
| 2014 | $1,286 +2% | $6,916 |
| 2013 | $1,261 +1.4% | $6,916 |
| 2012 | $1,244 -16.2% | $6,916 -24.3% |
| 2011 | $1,484 -0.4% | $9,137 |
| 2010 | $1,490 +4.4% | $9,137 |
| 2009 | $1,428 +4.3% | $9,137 -4% |
| 2008 | $1,368 +113.8% | $9,522 |
| 2007 | $640 +0.8% | $9,522 |
| 2006 | $635 -5.2% | $9,522 +54.7% |
| 2005 | $670 +1.9% | $6,154 |
| 2004 | $658 +4.4% | $6,154 |
| 2003 | $630 +30.3% | $6,154 +11.5% |
| 2002 | $483 +17.4% | $5,520 |
| 2001 | $411 +68.1% | $5,520 |
| 2000 | $245 | $5,520 +25.9% |
| 1999 | -- | $4,383 |
Find assessor info on the county website
Monthly payment
Estimated monthly payment
All calculations are estimates and provided by Zillow, Inc. for informational purposes only. Actual amounts may vary.
HOA fees may include property taxes on listings classified as Co-Ops. Contact the listing agent and/or owner for fee details.
Mortgage interest rates are dependent on a number of factors, including credit score, down payment, and repayment length. Interest rate data provided by Zillow Group Marketplace, Inc. as of 1/1/1970 from various mortgage lenders with which we have lead or other similar arrangements; the Estimated Payment is an average of those rates.
See how much you could borrow to make a competitive offer.
Climate risks
Neighborhood: Jeffery Manor
Nearby schools
GreatSchools rating
- 4/10Burnham Elementary Inclusive AcademyGrades: PK-8Distance: 0.3 mi
- 1/10Bowen High SchoolGrades: 9-12Distance: 1.1 mi
- Illinois
- Cook County
- Chicago
- 60617
- Jeffery Manor
- 9657 S Yates Blvd
Nearby cities
Nearby neighborhoods
Nearby zip codes
Other Chicago Topics
