$227,600
2 bd|2 ba|1k sqft
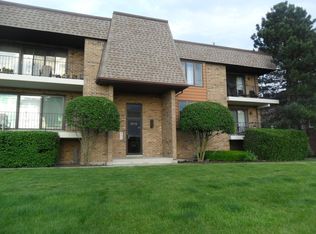
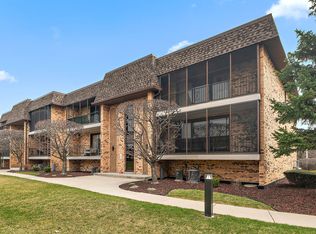
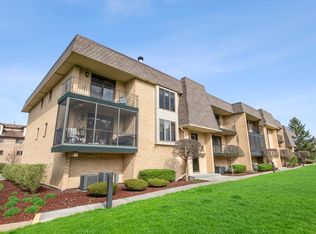
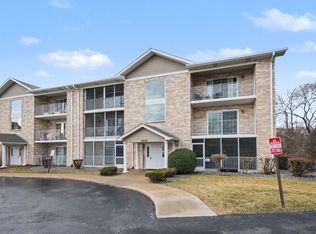
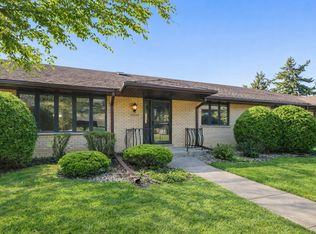
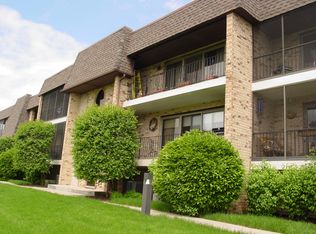
15702 Foxbend Ct APT 1S, Orland Park, IL 60462
Off Market
Zillow last checked:
Listing updated:
Eric Garza 708-524-1100,
Coldwell Banker Realty
Not available
Estimated sales range
Not available
Not available
| Date | Event | Price |
|---|---|---|
| 4/1/2026 | Price change | $240,000-4%$178/sqft |
Source: | ||
| 3/15/2026 | Listed for sale | $250,000+70.1%$185/sqft |
Source: | ||
| 12/5/2019 | Sold | $147,000-1.7%$109/sqft |
Source: | ||
| 11/7/2019 | Pending sale | $149,500$111/sqft |
Source: CENTURY 21 Affiliated #10464980 Report a problem | ||
| 9/11/2019 | Price change | $149,500-2.3%$111/sqft |
Source: CENTURY 21 Affiliated #10464980 Report a problem | ||
| 7/26/2019 | Listed for sale | $153,000+4.8%$113/sqft |
Source: Century 21 Affiliated #10464980 Report a problem | ||
| 10/30/2017 | Sold | $146,000-5.7%$108/sqft |
Source: | ||
| 9/29/2017 | Pending sale | $154,900$115/sqft |
Source: RE/MAX Synergy #09746939 Report a problem | ||
| 9/11/2017 | Listed for sale | $154,900+19.2%$115/sqft |
Source: RE/MAX Synergy #09746939 Report a problem | ||
| 3/26/1996 | Sold | $130,000+0.8%$96/sqft |
Source: Public Record Report a problem | ||
| 9/11/1995 | Sold | $129,000$96/sqft |
Source: Public Record Report a problem | ||
| Year | Property taxes | Tax assessment |
|---|---|---|
| 2023 | $1,741 -10.5% | $18,808 +41.1% |
| 2022 | $1,945 +0.8% | $13,332 |
| 2021 | $1,930 -48% | $13,332 |
| 2020 | $3,713 +2.2% | $13,332 +0.7% |
| 2019 | $3,632 +2.8% | $13,234 |
| 2018 | $3,533 +2.3% | $13,234 |
| 2017 | $3,453 +7.4% | $13,234 +14.9% |
| 2016 | $3,215 +1% | $11,522 |
| 2015 | $3,184 +64.3% | $11,522 |
| 2014 | $1,938 -45.3% | $11,522 -16.7% |
| 2013 | $3,543 +139.7% | $13,824 |
| 2012 | $1,478 -56.3% | $13,824 |
| 2011 | $3,383 +166.8% | $13,824 -16% |
| 2010 | $1,268 +3.9% | $16,458 |
| 2009 | $1,220 -4% | $16,458 -5% |
| 2008 | $1,272 -11.4% | $17,324 +16.2% |
| 2007 | $1,436 -3.9% | $14,908 |
| 2006 | $1,494 -3% | $14,908 |
| 2005 | $1,540 -9.9% | $14,908 +11.8% |
| 2004 | $1,709 -1.2% | $13,330 -3.8% |
| 2003 | $1,730 +3.2% | $13,857 |
| 2002 | $1,677 -11.1% | $13,857 +9.3% |
| 2001 | $1,885 +1.1% | $12,679 |
| 2000 | $1,864 | $12,679 |
| 1999 | $1,864 | $12,679 |
Find assessor info on the county website
Source: MRED as distributed by MLS GRID. This data may not be complete. We recommend contacting the local school district to confirm school assignments for this home.
A local agent can set up tours, give advice and negotiate with sellers.