Great living space. Minutes from Ybor City, Highway i4 and minutes from i75. Walking distance from the Hard Rock Casino.
Renter is responsible for all utilities internet and water fees. No smoking inside home. Monthly maintenance check. Owner responsible for lawn maintenance.
Pre-foreclosure
Est. $285,300
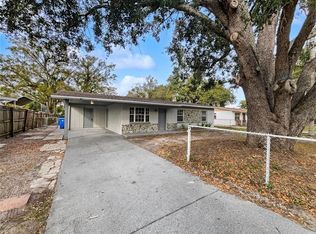
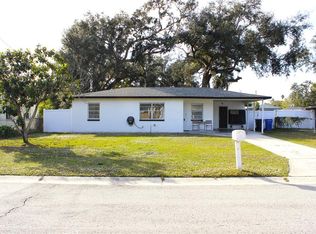
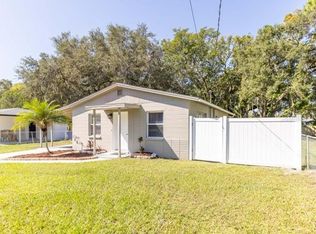
4203 Orient Rd, Tampa, FL 33610
3beds
1,364sqft
Single Family Residence
Built in ----
-- sqft lot
$285,300 Zestimate®
$209/sqft
$-- HOA
What's special
Great living space
- 76 days |
- 21 |
- 0 |
Zillow last checked: 8 hours ago
Listing updated: September 16, 2025 at 06:34pm
Source: Zillow Rentals
Facts & features
Interior
Bedrooms & bathrooms
- Bedrooms: 3
- Bathrooms: 1
- Full bathrooms: 1
Cooling
- Central Air
Appliances
- Included: Dishwasher, Freezer, Microwave, Oven, Refrigerator
- Laundry: None
Features
- Flooring: Hardwood, Tile
- Furnished: Yes
Interior area
- Total interior livable area: 1,364 sqft
Property
Parking
- Parking features: Detached
- Details: Contact manager
Features
- Exterior features: Internet not included in rent, No Utilities included in rent, Water not included in rent
Details
- Parcel number: 1929021MK000001000090U
Construction
Type & style
- Home type: SingleFamily
- Property subtype: Single Family Residence
Community & HOA
HOA
- Deposit fee: $1,000
- Administrative fee: $100
Location
- Region: Tampa
Financial & listing details
- Price per square foot: $209/sqft
- Tax assessed value: $215,849
- Annual tax amount: $2,286
- Date on market: 9/16/2025
- Date available: 10/01/2025
- Lease term: 1 Month
Visit our professional directory to find a foreclosure specialist in your area that can help with your home search.
Find a foreclosure agentForeclosure details
Estimated market value
$285,300
$265,000 - $302,000
$2,041/mo
Price history
Price history
| Date | Event | Price |
|---|---|---|
| 8/9/2025 | Listed for rent | $2,300+109.1%$2/sqft |
Source: Zillow Rentals Report a problem | ||
| 2/5/2019 | Sold | $146,000+0.7%$107/sqft |
Source: Public Record Report a problem | ||
| 11/30/2018 | Price change | $145,000-1%$106/sqft |
Source: RE/MAX REALTY UNLIMITED #T3128294 Report a problem | ||
| 11/23/2018 | Price change | $146,500-0.3%$107/sqft |
Source: RE/MAX REALTY UNLIMITED #T3128294 Report a problem | ||
| 11/2/2018 | Price change | $147,000-1.9%$108/sqft |
Source: RE/MAX REALTY UNLIMITED #T3128294 Report a problem | ||
| 11/1/2018 | Listed for sale | $149,900$110/sqft |
Source: RE/MAX REALTY UNLIMITED #T3128294 Report a problem | ||
| 9/22/2018 | Listing removed | $149,900$110/sqft |
Source: RE/MAX REALTY UNLIMITED #T3128294 Report a problem | ||
| 9/21/2018 | Pending sale | $149,900$110/sqft |
Source: RE/MAX REALTY UNLIMITED #T3128294 Report a problem | ||
| 9/4/2018 | Listed for sale | $149,900+148.6%$110/sqft |
Source: RE/MAX REALTY UNLIMITED #T3128294 Report a problem | ||
| 10/7/2017 | Listing removed | $1,100$1/sqft |
Source: RE/MAX REALTY UNLIMITED #T2904792 Report a problem | ||
| 9/23/2017 | Listed for rent | $1,100$1/sqft |
Source: RE/MAX REALTY UNLIMITED #T2904792 Report a problem | ||
| 11/3/2011 | Sold | $60,300+0.7%$44/sqft |
Source: Public Record Report a problem | ||
| 9/1/2011 | Listed for sale | $59,900+33.1%$44/sqft |
Source: Fannie Mae #T2485600 Report a problem | ||
| 7/9/2011 | Listing removed | $45,000$33/sqft |
Source: MREI CORPORATION #T2475579 Report a problem | ||
| 6/21/2011 | Listed for sale | $45,000-64%$33/sqft |
Source: MREI CORPORATION #T2475579 Report a problem | ||
| 4/25/2006 | Sold | $125,000+45.3%$92/sqft |
Source: Public Record Report a problem | ||
| 9/30/2002 | Sold | $86,000+115.4%$63/sqft |
Source: Public Record Report a problem | ||
| 9/12/2001 | Sold | $39,928$29/sqft |
Source: Public Record Report a problem | ||
Public tax history
Public tax history
| Year | Property taxes | Tax assessment |
|---|---|---|
| 2024 | $2,286 +4.9% | $140,927 +3% |
| 2023 | $2,179 +7.7% | $136,822 +3% |
| 2022 | $2,024 +1.8% | $132,837 +3% |
| 2021 | $1,988 +4.3% | $128,968 +1.4% |
| 2020 | $1,906 -13.8% | $127,187 +21.9% |
| 2019 | $2,211 | $104,354 -15.9% |
| 2018 | $2,211 -15% | $124,012 +51% |
| 2017 | $2,602 +230.6% | $82,141 +57.8% |
| 2016 | $787 +1.9% | $52,058 +0.7% |
| 2015 | $772 +8.6% | $51,696 +7.9% |
| 2014 | $712 | $47,892 +1.5% |
| 2013 | $712 +1.1% | $47,184 +1.7% |
| 2012 | $704 +32% | $46,395 +22.3% |
| 2011 | $533 -28.5% | $37,933 -22% |
| 2010 | $746 -14.6% | $48,611 -23.7% |
| 2009 | $874 -36.1% | $63,690 -33.2% |
| 2008 | $1,367 -17.9% | $95,397 -0.9% |
| 2007 | $1,665 +53.7% | $96,260 +49.1% |
| 2006 | $1,083 +1.2% | $64,570 +3% |
| 2005 | $1,070 | $62,689 +3% |
| 2004 | -- | $60,863 +1.9% |
| 2003 | -- | $59,728 +2.6% |
| 2002 | -- | $58,242 +67.3% |
| 2001 | -- | $34,818 -27.1% |
| 2000 | $414 | $47,776 |
Find assessor info on the county website
BuyAbility℠ payment
Estimated monthly payment
Boost your down payment with 6% savings match
Earn up to a 6% match & get a competitive APY with a *. Zillow has partnered with to help get you home faster.
Learn more*Terms apply. Match provided by Foyer. Account offered by Pacific West Bank, Member FDIC.Climate risks
Neighborhood: 33610
Nearby schools
GreatSchools rating
- 7/10Kenly Elementary SchoolGrades: PK-5Distance: 1.1 mi
- 3/10Mann Middle SchoolGrades: 6-8Distance: 6 mi
- 2/10Blake High SchoolGrades: 9-12Distance: 5.9 mi