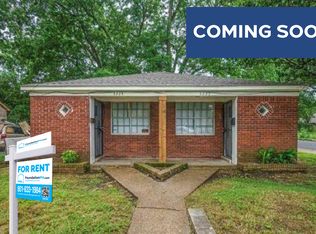
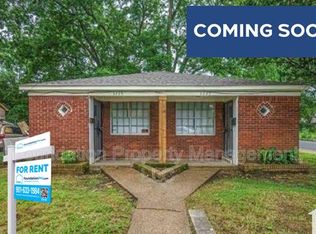
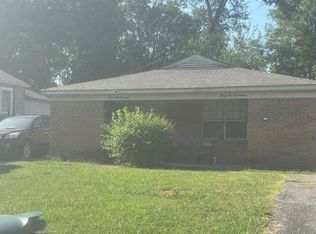
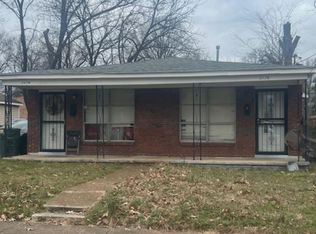
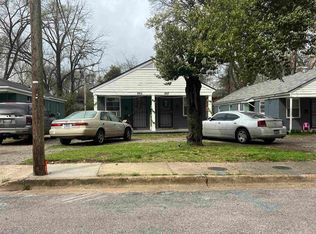
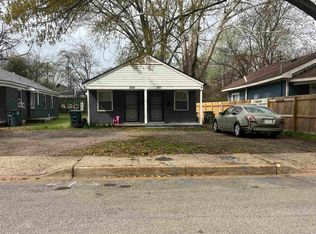
Renovated duplex in 38112. Vinyl flooring throughout, renovated bathrooms, central heat and air. These units are move in ready. Both sides are vacant as well. Potential rent is $850/month for each side. Call the listing agent for any questions.
Closed
Est. $129,300
3223 Guernsey Ave, Memphis, TN 38112
4beds
2baths
1,660sqft
Multi Family
Built in 1964
-- sqft lot
$-- Zestimate®
$78/sqft
$-- HOA
Overview
- 34 days |
- 156 |
- 2 |
Zillow last checked: 7 hours ago
Listing updated: October 09, 2025 at 08:41am
Listing Provided by:
Lloyd Patterson 901-679-8684,
Century 21 Patterson & Associates Real Estate Co.
Source: RealTracs MLS as distributed by MLS GRID,MLS#: 3008103
Facts & features
Interior
Bedrooms & bathrooms
- Bedrooms: 4
- Bathrooms: 2
Heating
- Central
Cooling
- Central Air
Features
- Flooring: Tile, Vinyl
Interior area
- Total structure area: 1,660
- Total interior livable area: 1,660 sqft
Property
Features
- Levels: Three Or More
- Stories: 1
Lot
- Size: 5,969 Square Feet
- Dimensions: 47 x 127
Details
- Parcel number: 038021 00022
- Special conditions: Standard
Construction
Type & style
- Home type: MultiFamily
- Property subtype: Multi Family
- Attached to another structure: Yes
Condition
- New construction: No
- Year built: 1964
Community & HOA
Community
- Subdivision: Hudson-Guernsey
Location
- Region: Memphis
Financial & listing details
- Price per square foot: $78/sqft
- Tax assessed value: $129,300
- Annual tax amount: $992
- Date on market: 10/2/2025
Visit our professional directory to find a foreclosure specialist in your area that can help with your home search.
Find a foreclosure agentForeclosure details
Estimated market value
Not available
Estimated sales range
Not available
$906/mo
Price history
Price history
| Date | Event | Price |
|---|---|---|
| 2/27/2026 | Sold | $50,600-15.7%$30/sqft |
Source: Public Record Report a problem | ||
| 8/20/2025 | Pending sale | $60,000$36/sqft |
Source: | ||
| 8/12/2025 | Listed for sale | $60,000+20%$36/sqft |
Source: | ||
| 7/24/2025 | Listing removed | $795 |
Source: Zillow Rentals Report a problem | ||
| 4/30/2025 | Listing removed | $50,000$30/sqft |
Source: | ||
| 4/8/2025 | Listed for rent | $795 |
Source: Zillow Rentals Report a problem | ||
| 3/26/2025 | Pending sale | $50,000$30/sqft |
Source: | ||
| 3/18/2025 | Listed for sale | $50,000-63%$30/sqft |
Source: | ||
| 7/17/2024 | Sold | $135,000-3.5%$81/sqft |
Source: | ||
| 6/3/2024 | Contingent | $139,900$84/sqft |
Source: | ||
| 5/27/2024 | Listed for sale | $139,900+210.9%$84/sqft |
Source: | ||
| 7/26/2023 | Sold | $45,000+50%$27/sqft |
Source: Public Record Report a problem | ||
| 1/11/2005 | Sold | $30,000$18/sqft |
Source: Public Record Report a problem | ||
Public tax history
Public tax history
| Year | Property taxes | Tax assessment |
|---|---|---|
| 2025 | $1,704 +58.9% | $32,325 +98.6% |
| 2024 | $1,072 +8.1% | $16,280 |
| 2023 | $992 | $16,280 |
| 2022 | -- | $16,280 |
| 2021 | -- | $16,280 -11.3% |
| 2020 | $587 | $18,360 |
| 2019 | $587 -21.1% | $18,360 |
| 2018 | $744 -45.1% | $18,360 |
| 2017 | $1,355 +73.6% | $18,360 -20% |
| 2016 | $781 -7.7% | $22,960 |
| 2014 | $846 | $22,960 |
| 2013 | -- | $22,960 -13.4% |
| 2012 | -- | $26,520 |
| 2011 | -- | $26,520 |
| 2010 | -- | $26,520 -18.1% |
| 2009 | -- | $32,400 +24.4% |
| 2008 | -- | $26,040 |
| 2007 | -- | $26,040 |
| 2006 | -- | $26,040 |
| 2005 | -- | $26,040 +77.9% |
| 2004 | -- | $14,640 |
| 2003 | -- | $14,640 |
| 2002 | -- | $14,640 -35.8% |
| 2001 | -- | $22,800 +49.6% |
| 2000 | -- | $15,240 |
Find assessor info on the county website
Monthly payment
Estimated monthly payment
All calculations are estimates and provided by Zillow, Inc. for informational purposes only. Actual amounts may vary.
HOA fees may include property taxes on listings classified as Co-Ops. Contact the listing agent and/or owner for fee details.
Mortgage interest rates are dependent on a number of factors, including credit score, down payment, and repayment length. Interest rate data provided by Zillow Group Marketplace, Inc. as of 1/1/1970 from various mortgage lenders with which we have lead or other similar arrangements; the Estimated Payment is an average of those rates.
See how much you could borrow to make a competitive offer.
Climate risks
Neighborhood: Berclair-Highland Heights
Nearby schools
GreatSchools rating
- 3/10Treadwell Elementary SchoolGrades: PK-5Distance: 0.6 mi
- 5/10Treadwell Middle SchoolGrades: 6-8Distance: 0.6 mi
- 2/10Douglass High SchoolGrades: 9-12Distance: 1.2 mi
- Tennessee
- Shelby County
- Memphis
- 38112
- Berclair-Highland Heights
- 3223 Guernsey Ave
Nearby cities
Nearby neighborhoods
- Cordova-Appling Real estate
- Downtown Real estate
- East Memphis-Colonial-Yorkshire Real estate
- Hickory Ridge-South Riverdale Real estate
- Midtown Real estate
- Parkway Village-Oakhaven Real estate
- Raleigh Real estate
- River Oaks-Kirby-Balmoral Real estate
- Shelby Forest-Frayser Real estate
- White Haven-Coro Lake Real estate
Nearby zip codes
Other Memphis Topics
