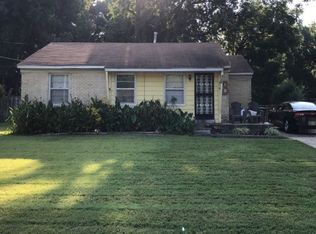
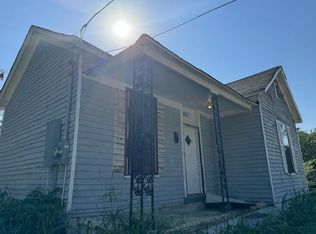
Calling all investor buyers! HUGE PRICE DROP! This 3 bedroom home is currently available and is an excellent long term hold! Home has a nice layout & is on a corner lot! ONLINE VIDEO AVAILABLE UPON REQUEST! Many homes in this area are being rehabbed and sold for more money. Owner is also selling 177 Modder (can buy them individually or in bulk). Cash offers only. No wholesale or assignments...no creative/owner financing. Please do all inspections up front. Property being sold as-is.
For sale
$44,900
324 Outer Pkwy, Memphis, TN 38109
3beds
1,095sqft
Est.:
Single Family Residence
Built in 1947
10,018.8 Square Feet Lot
$-- Zestimate®
$41/sqft
$-- HOA
What's special
Nice layoutCorner lot
- 466 days |
- 124 |
- 10 |
Zillow last checked: 8 hours ago
Listing updated: August 26, 2025 at 07:46am
Listed by:
Tyler Tapley,
Crye-Leike, Inc., REALTORS 901-756-8900
Source: MAAR,MLS#: 10185698
Facts & features
Interior
Bedrooms & bathrooms
- Bedrooms: 3
- Bathrooms: 1
- Full bathrooms: 1
Primary bedroom
- Width: 0
Dining room
- Width: 0
Kitchen
- Features: Pantry
Living room
- Width: 0
Den
- Width: 0
Heating
- Central
Cooling
- Window Unit(s)
Features
- All Bedrooms Down
- Flooring: Part Carpet
- Has fireplace: No
Interior area
- Total interior livable area: 1,095 sqft
Property
Parking
- Parking features: Driveway/Pad
- Has uncovered spaces: Yes
Features
- Stories: 1
- Exterior features: Other (See REMARKS)
- Pool features: None
Lot
- Size: 10,018.8 Square Feet
- Dimensions: 77 x 135
- Features: Level
Details
- Parcel number: 050003 00005
Construction
Type & style
- Home type: SingleFamily
- Architectural style: Traditional
- Property subtype: Single Family Residence
Materials
- Aluminum/Steel Siding, Vinyl Siding
Condition
- New construction: No
- Year built: 1947
Community & HOA
Community
- Subdivision: Garretts Revised Plan Of Goodman Bros
Location
- Region: Memphis
Financial & listing details
- Price per square foot: $41/sqft
- Tax assessed value: $57,100
- Annual tax amount: $478
- Price range: $44.9K - $44.9K
- Date on market: 11/22/2024
- Cumulative days on market: 467 days
Estimated market value
Not available
Estimated sales range
Not available
$964/mo
Price history
Price history
| Date | Event | Price |
|---|---|---|
| 4/10/2025 | Price change | $44,900-18.2%$41/sqft |
Source: | ||
| 3/25/2025 | Price change | $54,900-0.2%$50/sqft |
Source: | ||
| 3/7/2025 | Price change | $55,000-15.4%$50/sqft |
Source: | ||
| 1/29/2025 | Price change | $65,000-13.3%$59/sqft |
Source: | ||
| 11/22/2024 | Listed for sale | $75,000-11.8%$68/sqft |
Source: | ||
| 6/30/2023 | Listing removed | -- |
Source: | ||
| 4/25/2023 | Listed for sale | $85,000+13.3%$78/sqft |
Source: | ||
| 3/31/2022 | Listing removed | -- |
Source: | ||
| 2/2/2022 | Listed for sale | $75,000+141.9%$68/sqft |
Source: | ||
| 1/24/2022 | Sold | $31,000-58.7%$28/sqft |
Source: Public Record Report a problem | ||
| 1/5/2022 | Listed for sale | $75,000+552.2%$68/sqft |
Source: | ||
| 6/16/2018 | Listing removed | $650$1/sqft |
Source: Stephen Polk Report a problem | ||
| 5/22/2018 | Listed for rent | $650$1/sqft |
Source: Stephen Polk Report a problem | ||
| 5/20/2018 | Sold | $11,500-22.8%$11/sqft |
Source: | ||
| 4/5/2018 | Listed for sale | $14,900+86.3%$14/sqft |
Source: Leco Realty, Inc. #10023997 Report a problem | ||
| 5/17/2013 | Sold | $8,000-42.9%$7/sqft |
Source: | ||
| 7/21/2011 | Sold | $14,000-70.2%$13/sqft |
Source: Public Record Report a problem | ||
| 2/9/2007 | Sold | $47,000+23.7%$43/sqft |
Source: Public Record Report a problem | ||
| 10/4/2006 | Sold | $38,000+126.1%$35/sqft |
Source: Public Record Report a problem | ||
| 5/18/2006 | Sold | $16,810+40.1%$15/sqft |
Source: Public Record Report a problem | ||
| 12/16/2002 | Sold | $12,000$11/sqft |
Source: Public Record Report a problem | ||
Public tax history
Public tax history
| Year | Property taxes | Tax assessment |
|---|---|---|
| 2025 | $752 +45.5% | $14,275 +81.8% |
| 2024 | $517 +8.1% | $7,850 |
| 2023 | $478 | $7,850 |
| 2022 | -- | $7,850 |
| 2021 | -- | $7,850 +22.2% |
| 2020 | $205 | $6,425 |
| 2019 | $205 -21.1% | $6,425 |
| 2018 | $260 -45.1% | $6,425 |
| 2017 | $474 +108.2% | $6,425 -4.1% |
| 2016 | $228 -16.2% | $6,700 |
| 2014 | $272 | $6,700 |
| 2013 | -- | $6,700 -21.4% |
| 2012 | -- | $8,525 |
| 2011 | -- | $8,525 |
| 2010 | -- | $8,525 |
| 2009 | -- | $8,525 -2.6% |
| 2008 | -- | $8,750 |
| 2007 | -- | $8,750 |
| 2006 | -- | $8,750 |
| 2005 | -- | $8,750 +75% |
| 2004 | -- | $5,000 |
| 2003 | -- | $5,000 |
| 2002 | -- | $5,000 -34% |
| 2001 | -- | $7,575 +57% |
| 2000 | -- | $4,825 |
Find assessor info on the county website
BuyAbility℠ payment
Est. payment
$268/mo
Principal & interest
$232
Property taxes
$36
Climate risks
Neighborhood: Downtown
Getting around
16 / 100
Minimal TransitNearby schools
GreatSchools rating
- 6/10Riverview Middle SchoolGrades: PK-8Distance: 0.2 mi
- 3/10Hamilton High SchoolGrades: 9-12Distance: 3.2 mi
Local experts in 38109