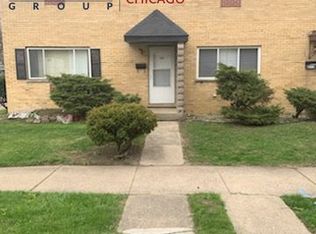
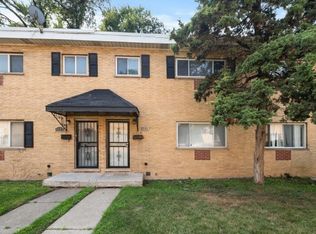
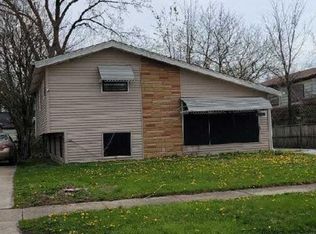
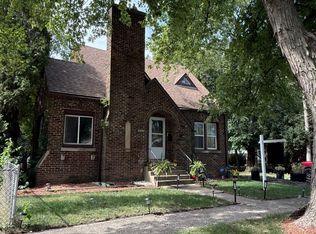
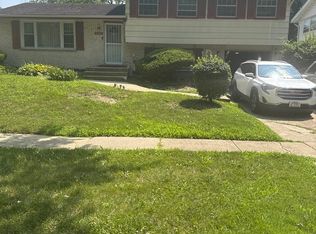
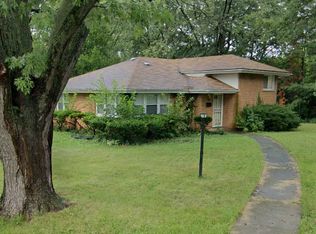
This 1160 square foot single family home has 3 bedrooms and 1.5 bathrooms. This home is located at 2195 171st St, Hazel Crest, IL 60429.
Foreclosed
Est. $132,000
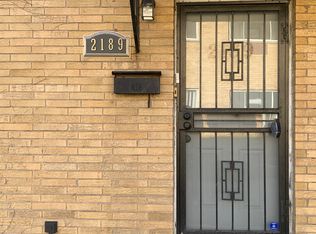
2195 171st St, Hazel Crest, IL 60429
3beds
1baths
1,160sqft
SingleFamily
Built in 1965
2,278 Square Feet Lot
$132,000 Zestimate®
$114/sqft
$-- HOA
Overview
- 190 days |
- 19 |
- 0 |
Facts & features
Interior
Bedrooms & bathrooms
- Bedrooms: 3
- Bathrooms: 1.5
Heating
- Forced air, Gas
Cooling
- Central
Appliances
- Included: Dishwasher, Range / Oven, Refrigerator
Features
- Flooring: Tile, Other, Carpet
Interior area
- Total interior livable area: 1,160 sqft
Property
Parking
- Total spaces: 2
- Parking features: None
Features
- Exterior features: Brick
Lot
- Size: 2,278 Square Feet
Details
- Parcel number: 2930300063
Construction
Type & style
- Home type: SingleFamily
Materials
- Foundation: Crawl/Raised
- Roof: Built-up
Condition
- Year built: 1965
Community & HOA
Location
- Region: Hazel Crest
Financial & listing details
- Price per square foot: $114/sqft
- Tax assessed value: $57,000
- Annual tax amount: $3,651
Visit our professional directory to find a foreclosure specialist in your area that can help with your home search.
Find a foreclosure agentForeclosure details
Estimated market value
$132,000
$112,000 - $150,000
$2,391/mo
Price history
Price history
| Date | Event | Price |
|---|---|---|
| 11/10/2021 | Sold | $90,000$78/sqft |
Source: | ||
| 9/11/2021 | Pending sale | $90,000$78/sqft |
Source: | ||
| 9/11/2021 | Listed for sale | $90,000+42.9%$78/sqft |
Source: | ||
| 11/5/2019 | Listing removed | $1,450$1/sqft |
Source: RE/MAX "10" Midway #10540098 Report a problem | ||
| 10/29/2019 | Price change | $1,450+7.4%$1/sqft |
Source: RE/MAX "10" Midway #10540098 Report a problem | ||
| 10/7/2019 | Listed for rent | $1,350$1/sqft |
Source: RE/MAX 10 #10540098 Report a problem | ||
| 9/21/2019 | Listing removed | $62,999$54/sqft |
Source: eXp Realty #10362199 Report a problem | ||
| 9/6/2019 | Listed for sale | $62,999+215%$54/sqft |
Source: eXp Realty #10362199 Report a problem | ||
| 11/20/2017 | Sold | $20,000+42.9%$17/sqft |
Source: | ||
| 9/22/2017 | Pending sale | $14,000$12/sqft |
Source: Premier Midwest Realty INC #09748706 Report a problem | ||
| 9/12/2017 | Listed for sale | $14,000-81.3%$12/sqft |
Source: Premier Midwest Realty INC #09748706 Report a problem | ||
| 8/11/2016 | Listing removed | -- |
Source: Auction.com Report a problem | ||
| 7/12/2016 | Listed for sale | -- |
Source: Auction.com Report a problem | ||
| 10/31/2001 | Sold | $75,000+29.3%$65/sqft |
Source: Public Record Report a problem | ||
| 12/6/1995 | Sold | $58,000$50/sqft |
Source: Public Record Report a problem | ||
Public tax history
Public tax history
| Year | Property taxes | Tax assessment |
|---|---|---|
| 2023 | $3,651 +26% | $5,700 +70.3% |
| 2022 | $2,898 +2.9% | $3,348 |
| 2021 | $2,817 +6.7% | $3,348 |
| 2020 | $2,641 -29.3% | $3,348 -29.9% |
| 2019 | $3,735 +2.8% | $4,776 |
| 2018 | $3,635 +252.4% | $4,776 |
| 2017 | $1,031 -30.2% | $4,776 +2% |
| 2016 | $1,477 +9.4% | $4,683 |
| 2015 | $1,351 -1.3% | $4,683 |
| 2014 | $1,369 -2.3% | $4,683 -6.4% |
| 2013 | $1,401 +2.8% | $5,002 |
| 2012 | $1,363 -12.5% | $5,002 |
| 2011 | $1,557 -29% | $5,002 -23.9% |
| 2010 | $2,194 +3.3% | $6,574 |
| 2009 | $2,125 +9.6% | $6,574 -5% |
| 2008 | $1,938 -11% | $6,920 -9.9% |
| 2007 | $2,177 +5.8% | $7,684 |
| 2006 | $2,059 +10.3% | $7,684 |
| 2005 | $1,867 -3.4% | $7,684 +6.7% |
| 2004 | $1,934 +1.3% | $7,199 |
| 2003 | $1,908 -24.9% | $7,199 |
| 2002 | $2,539 +115.1% | $7,199 +21.3% |
| 2001 | $1,181 -32.2% | $5,937 |
| 2000 | $1,742 -2.9% | $5,937 |
| 1999 | $1,793 | $5,937 |
Find assessor info on the county website
Monthly payment
Estimated monthly payment
All calculations are estimates and provided by Zillow, Inc. for informational purposes only. Actual amounts may vary.
HOA fees may include property taxes on listings classified as Co-Ops. Contact the listing agent and/or owner for fee details.
Mortgage interest rates are dependent on a number of factors, including credit score, down payment, and repayment length. Interest rate data provided by Zillow Group Marketplace, Inc. as of 1/1/1970 from various mortgage lenders with which we have lead or other similar arrangements; the Estimated Payment is an average of those rates.
See how much you could borrow to make a competitive offer.
Climate risks
Neighborhood: 60429
Nearby schools
GreatSchools rating
- 1/10Jesse C White Learning AcademyGrades: PK-8Distance: 0.3 mi
- 3/10Thornwood High SchoolGrades: 9-12Distance: 3.4 mi
- Illinois
- Cook County
- Hazel Crest
- 60429
- 2195 171st St
Nearby cities
Nearby zip codes
Other Hazel Crest Topics
