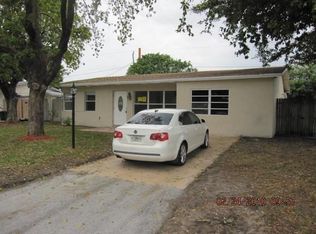
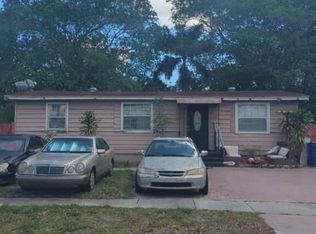
This 1159 square foot single family home has 3 bedrooms and 2.0 bathrooms. This home is located at 3160 NE 11th Ave, Pompano Beach, FL 33064.
Pre-foreclosure
Est. $475,800
3160 NE 11th Ave, Pompano Beach, FL 33064
3beds
2baths
1,159sqft
SingleFamily
Built in 1963
6,098 Square Feet Lot
$475,800 Zestimate®
$411/sqft
$-- HOA
Overview
- 156 days |
- 229 |
- 6 |
Facts & features
Interior
Bedrooms & bathrooms
- Bedrooms: 3
- Bathrooms: 2
Features
- First Floor Entry, Split Bedroom
- Flooring: Tile, Concrete
Interior area
- Total interior livable area: 1,159 sqft
Property
Features
- Exterior features: Stucco, Cement / Concrete
Lot
- Size: 6,098 Square Feet
Details
- Parcel number: 484224151460
Construction
Type & style
- Home type: SingleFamily
Materials
- masonry
- Foundation: Other
- Roof: Shake / Shingle
Condition
- Year built: 1963
Community & HOA
Community
- Subdivision: Cresthaven 5 40-4 B
Location
- Region: Pompano Beach
Financial & listing details
- Price per square foot: $411/sqft
- Tax assessed value: $426,710
- Annual tax amount: $10,814
Visit our professional directory to find a foreclosure specialist in your area that can help with your home search.
Find a foreclosure agentForeclosure details
Estimated market value
$475,800
$447,000 - $504,000
$3,299/mo
Price history
Price history
| Date | Event | Price |
|---|---|---|
| 12/20/2023 | Sold | $25,000-90.7%$22/sqft |
Source: Public Record Report a problem | ||
| 10/9/2018 | Sold | $268,000-0.7%$231/sqft |
Source: | ||
| 8/31/2018 | Pending sale | $270,000$233/sqft |
Source: T International Realty LLC #F10119137 Report a problem | ||
| 8/16/2018 | Price change | $270,000-1.8%$233/sqft |
Source: T International Realty LLC #F10119137 Report a problem | ||
| 7/16/2018 | Price change | $275,000-3.5%$237/sqft |
Source: T International Realty LLC #F10119137 Report a problem | ||
| 6/22/2018 | Price change | $285,000-3.4%$246/sqft |
Source: T International Realty LLC #F10119137 Report a problem | ||
| 4/10/2018 | Listed for sale | $295,000+31.1%$255/sqft |
Source: Owner Report a problem | ||
| 5/23/2016 | Sold | $225,000-2.2%$194/sqft |
Source: Public Record Report a problem | ||
| 3/10/2016 | Pending sale | $230,000$198/sqft |
Source: Owner Report a problem | ||
| 3/1/2016 | Price change | $230,000-2.1%$198/sqft |
Source: Owner Report a problem | ||
| 2/2/2016 | Listed for sale | $235,000+33.1%$203/sqft |
Source: Owner Report a problem | ||
| 5/15/2014 | Sold | $176,500+76.5%$152/sqft |
Source: Public Record Report a problem | ||
| 11/5/2013 | Sold | $100,000+35.1%$86/sqft |
Source: | ||
| 7/20/2011 | Sold | $74,000+5.9%$64/sqft |
Source: Public Record Report a problem | ||
| 4/21/2011 | Price change | $69,900-7%$60/sqft |
Source: Keyes Real Estate, Mortgage, Title - Lighthouse Point #F1130491 Report a problem | ||
| 4/15/2011 | Listed for sale | -- |
Source: foreclosure.com Report a problem | ||
| 4/6/2011 | Sold | $75,200-19.1%$65/sqft |
Source: Public Record Report a problem | ||
| 6/20/2000 | Sold | $93,000+52.5%$80/sqft |
Source: Public Record Report a problem | ||
| 8/8/1993 | Sold | $61,000$53/sqft |
Source: Public Record Report a problem | ||
Public tax history
Public tax history
| Year | Property taxes | Tax assessment |
|---|---|---|
| 2024 | $10,814 +423.3% | $426,710 +58.1% |
| 2023 | $2,066 +4.6% | $269,910 +3% |
| 2022 | $1,975 +1.5% | $262,050 +3% |
| 2021 | $1,945 | $254,420 +1.4% |
| 2020 | $1,945 +784.2% | $250,910 +2.3% |
| 2019 | $220 | $245,270 +31.5% |
| 2018 | $220 -93% | $186,520 +2.1% |
| 2017 | $3,122 +5.4% | $182,690 +14.2% |
| 2016 | $2,962 +17.2% | $159,960 +0.7% |
| 2015 | $2,526 +22.3% | $158,850 +72.7% |
| 2014 | $2,066 | $92,000 -19% |
| 2013 | $2,066 +147% | $113,610 +53.3% |
| 2012 | $836 -57.3% | $74,130 -15.3% |
| 2011 | $1,957 -15.4% | $87,560 -15.8% |
| 2010 | $2,315 -33.4% | $104,040 -37.1% |
| 2009 | $3,477 -17.3% | $165,300 -21.9% |
| 2008 | $4,205 -9.8% | $211,630 -10.1% |
| 2007 | $4,661 +197% | $235,530 +147.9% |
| 2006 | $1,569 | $95,010 +3% |
| 2005 | -- | $92,250 +3% |
| 2004 | $1,616 +0.8% | $89,570 +1.9% |
| 2003 | $1,602 +1.2% | $87,900 +2.4% |
| 2002 | $1,583 -27.5% | $85,840 |
| 2001 | $2,183 +71.3% | $85,840 |
| 2000 | $1,275 | -- |
Find assessor info on the county website
Monthly payment
Estimated monthly payment
All calculations are estimates and provided by Zillow, Inc. for informational purposes only. Actual amounts may vary.
HOA fees may include property taxes on listings classified as Co-Ops. Contact the listing agent and/or owner for fee details.
Mortgage interest rates are dependent on a number of factors, including credit score, down payment, and repayment length. Interest rate data provided by Zillow Group Marketplace, Inc. as of 1/1/1970 from various mortgage lenders with which we have lead or other similar arrangements; the Estimated Payment is an average of those rates.
See how much you could borrow to make a competitive offer.
Climate risks
Neighborhood: Cresthaven
Nearby schools
GreatSchools rating
- 6/10Cresthaven Elementary SchoolGrades: PK-5Distance: 0.7 mi
- 3/10Crystal Lake Community Middle SchoolGrades: 6-8Distance: 0.7 mi
- 4/10Deerfield Beach High SchoolGrades: 9-12Distance: 1.8 mi


- Florida
- Broward County
- Pompano Beach
- 33064
- Cresthaven
- 3160 NE 11th Ave
Nearby cities
Nearby neighborhoods
Nearby zip codes
Other Pompano Beach Topics
