$223,900
-- bd|1 ba|755 sqft
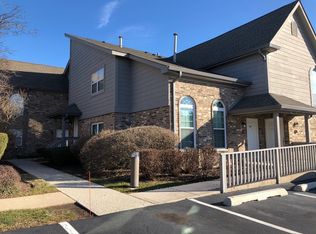
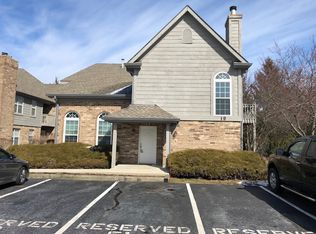
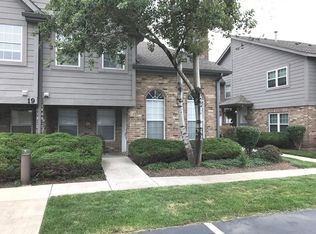
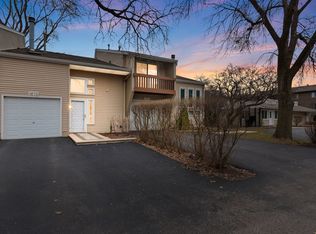
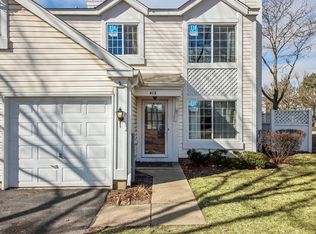
15 Foxcroft Rd APT 219, Naperville, IL 60565
Off Market
Likely to sell faster than
Zillow last checked: 7 hours ago
Listing updated: March 13, 2026 at 07:31am
Usman Taj 847-997-5228,
Baird & Warner
Not available
Estimated sales range
Not available
Not available
| Date | Event | Price |
|---|---|---|
| 3/13/2026 | Listed for sale | $285,000+13155.8%$264/sqft |
Source: | ||
| 7/10/2024 | Listing removed | -- |
Source: | ||
| 3/2/2024 | Listing removed | $2,150$2/sqft |
Source: | ||
| 1/19/2024 | Pending sale | $2,150-99.1%$2/sqft |
Source: | ||
| 12/21/2023 | Listed for rent | $2,150$2/sqft |
Source: | ||
| 12/12/2023 | Listing removed | -- |
Source: | ||
| 11/30/2023 | Listed for rent | $2,150-2.3%$2/sqft |
Source: | ||
| 10/4/2023 | Listing removed | -- |
Source: Zillow Rentals Report a problem | ||
| 8/8/2023 | Listed for rent | $2,200+69.2%$2/sqft |
Source: Zillow Rentals Report a problem | ||
| 6/9/2023 | Sold | $240,000+6.7%$222/sqft |
Source: | ||
| 5/26/2023 | Contingent | $225,000$208/sqft |
Source: | ||
| 5/22/2023 | Listed for sale | $225,000$208/sqft |
Source: | ||
| 5/2/2023 | Pending sale | $225,000$208/sqft |
Source: | ||
| 4/27/2023 | Listed for sale | $225,000+12.4%$208/sqft |
Source: | ||
| 10/6/2012 | Listing removed | $1,300$1/sqft |
Source: Re/Max Professionals Select #08152943 Report a problem | ||
| 9/7/2012 | Listed for rent | $1,300$1/sqft |
Source: RE/MAX Professionals Select #08152943 Report a problem | ||
| 12/20/2011 | Listing removed | $1,300$1/sqft |
Source: Re/Max Professionals Select #07947698 Report a problem | ||
| 12/9/2011 | Price change | $1,300-5.5%$1/sqft |
Source: Re/Max Professionals Select #07947698 Report a problem | ||
| 11/20/2011 | Listed for rent | $1,375$1/sqft |
Source: RE/MAX Professionals Select #07947698 Report a problem | ||
| 3/26/2007 | Sold | $200,163$185/sqft |
Source: | ||
| Year | Property taxes | Tax assessment |
|---|---|---|
| 2024 | $4,552 +3.3% | $74,300 +9.6% |
| 2023 | $4,406 +10.4% | $67,810 +10% |
| 2022 | $3,990 +3.6% | $61,650 +3.9% |
| 2021 | $3,850 +2.1% | $59,320 +1.8% |
| 2020 | $3,771 +2.8% | $58,250 +4.5% |
| 2019 | $3,668 +13.7% | $55,730 +13.7% |
| 2018 | $3,227 +1.9% | $49,020 +3.5% |
| 2017 | $3,168 +1.9% | $47,370 +3.8% |
| 2016 | $3,109 +0.3% | $45,650 +6.2% |
| 2015 | $3,099 +3.6% | $42,990 +7% |
| 2014 | $2,991 -6.6% | $40,180 -8.2% |
| 2013 | $3,201 -3.3% | $43,770 -10% |
| 2012 | $3,310 -7.8% | $48,640 -14.9% |
| 2011 | $3,591 -10.1% | $57,160 -15.6% |
| 2010 | $3,993 -4% | $67,720 -10.1% |
| 2009 | $4,161 +3.1% | $75,350 +1.4% |
| 2008 | $4,036 +11.5% | $74,310 +12.5% |
| 2007 | $3,619 +116.4% | $66,070 +122.4% |
| 2006 | $1,673 +3.3% | $29,710 +6.7% |
| 2005 | $1,619 | $27,850 |
Find assessor info on the county website
Source: MRED as distributed by MLS GRID. This data may not be complete. We recommend contacting the local school district to confirm school assignments for this home.