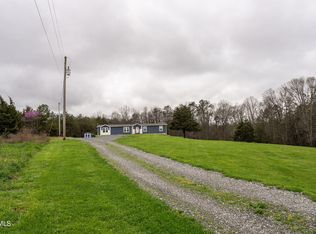
As-is Great investment opportunity! Property features scenic mountain views and includes a mobile home in need of significant repair. Perfect for renovation, rental potential, or a new build.
Active
Price cut: $4.9K (10/12)
$75,000
433 Obe Kirk Loop, Mohawk, TN 37810
3beds
840sqft
Manufactured Home
Built in 1981
1.03 Acres Lot
$-- Zestimate®
$89/sqft
$-- HOA
What's special
Scenic mountain views
- 163 days
- 1,237
- 47
Zillow last checked:
Listing updated:
Listed by:
Ashley Killough 865-412-7627,
Your Home Sold Guaranteed Real 865-365-2280
Source: East Tennessee Realtors,MLS#: 1342784
Facts & features
Interior
Bedrooms & bathrooms
- Bedrooms: 3
- Bathrooms: 2
- Full bathrooms: 2
Heating
- Heat Pump, Propane, Electric
Cooling
- Other
Appliances
- Included: Microwave, Refrigerator, Other
Features
- Eat-in Kitchen
- Flooring: Other, Laminate
- Basement: None
- Has fireplace: No
- Fireplace features: None
Interior area
- Total structure area: 840
- Total interior livable area: 840 sqft
Property
Parking
- Parking features: Other
Features
- Has view: Yes
- View description: Mountain(s)
Lot
- Size: 1.03 Acres
- Features: Other
Details
- Additional structures: Storage
- Parcel number: 080 038.11
Construction
Type & style
- Home type: MobileManufactured
- Property subtype: Manufactured Home
Materials
- Other, Aluminum Siding
Condition
- Year built: 1981
Utilities & green energy
- Sewer: Septic Tank
- Water: Public
Community & HOA
Location
- Region: Mohawk
Financial & listing details
- Price per square foot: $89/sqft
- Tax assessed value: $38,800
- Annual tax amount: $160
- Date on market: 8/31/2026
- Listing terms: USDA/Rural,Cash,Conventional
Estimated market value
Not available
Estimated sales range
Not available
$1,254/mo
Price history
| Date | Event | Price |
|---|---|---|
| 10/12/2026 | Price change | $75,000-6.1%$89/sqft |
Source:  East Tennessee Realtors #1342784 Report a problem | ||
| 8/31/2026 | Listed for sale | $79,900$95/sqft |
Source: East Tennessee Realtors #1342784 Report a problem | ||
| 8/2/2026 | Pending sale | $79,900$95/sqft |
Source: East Tennessee Realtors #1342784 Report a problem | ||
| 6/19/2026 | Price change | $79,9000%$95/sqft |
Source: East Tennessee Realtors #1342784 Report a problem | ||
| 6/12/2026 | Price change | $79,909-0.1%$95/sqft |
Source: East Tennessee Realtors #1342784 Report a problem | ||
| 6/5/2026 | Price change | $79,9900%$95/sqft |
Source: My State MLS #11735846 Report a problem | ||
| 5/28/2026 | Price change | $79,9990%$95/sqft |
Source: My State MLS #11735846 Report a problem | ||
| 5/21/2026 | Price change | $80,000-20%$95/sqft |
Source: My State MLS #11735846 Report a problem | ||
| 5/14/2026 | Price change | $99,9900%$119/sqft |
Source: My State MLS #11735846 Report a problem | ||
| 5/7/2026 | Price change | $99,9990%$119/sqft |
Source: My State MLS #11735846 Report a problem | ||
| 5/1/2026 | Listed for sale | $100,000+1566.7%$119/sqft |
Source: My State MLS #11735846 Report a problem | ||
| 10/5/2012 | Sold | $6,000-76%$7/sqft |
Source: Agent Provided Report a problem | ||
| 4/12/2006 | Sold | $25,000+100%$30/sqft |
Source: Agent Provided Report a problem | ||
| 11/15/2004 | Sold | $12,500+1150%$15/sqft |
Source: Agent Provided Report a problem | ||
| 8/4/1999 | Sold | $1,000$1/sqft |
Source: Agent Provided Report a problem | ||
Public tax history
| Year | Property taxes | Tax assessment |
|---|---|---|
| 2025 | $160 | $9,700 |
| 2024 | $160 | $9,700 |
| 2023 | $160 +45.1% | $9,700 +77.2% |
| 2022 | $110 | $5,475 |
| 2021 | $110 | $5,475 |
| 2020 | $110 | $5,475 |
| 2019 | $110 | $5,475 |
| 2018 | $110 +0.3% | $5,475 -0.5% |
| 2017 | $110 +0.9% | $5,500 |
| 2016 | $109 +5.8% | $5,500 |
| 2015 | $103 | $5,500 |
| 2014 | $103 -19.1% | $5,500 -28.1% |
| 2013 | $127 | $7,650 +2.7% |
| 2012 | $127 +13.4% | $7,450 -0.1% |
| 2010 | $112 | $7,455 |
| 2009 | $112 +14.3% | $7,455 +14.3% |
| 2008 | $98 | $6,522 |
| 2007 | -- | $6,522 -1.1% |
| 2006 | $129 | $6,592 |
| 2005 | $129 -83.4% | $6,592 -83.4% |
| 2004 | $776 | $39,804 |
Find assessor info on the county website
Monthly payment
Climate risks
Neighborhood: 37810
Similar homes
- $75,0002 bd1 ba480 sqft246 Midway Cir, Midway, TN 37809Active
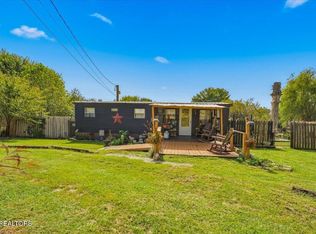
 MLS ID #1355514, Amber Vittetoe, MG Rise Real Estate Group. East Tennessee Realtors
- $69,9002 bd1 ba1k sqft6105 Highway 66 N, Rogersville, TN 37857For Sale
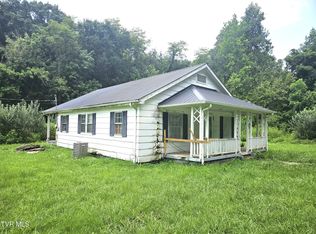 MLS ID #9998796, Stephen Nelson. TVRMLS
- $61,9953 bd1 ba950 sqft2215 Whirlwind Rd, Greeneville, TN 37743For Sale
 MLS ID #10000554, Jim Griffin. TVRMLS
- $94,9003 bd1 ba960 sqft105 Robinson St, Greeneville, TN 37743For Sale
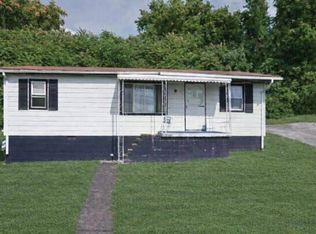 MLS ID #10001891, William Naranjo. TVRMLS
