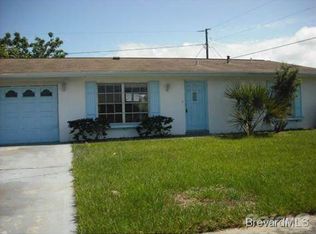
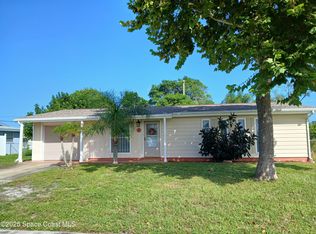
NEW LISTING, for sale by owner. This affordable corner lot home is move-in ready and has 3 bedrooms, two baths and a unique to this area, large two car garage!
Features include:
Brand new kitchen cabinets, counter tops and sink (Appliances are used and in working order, left behind for you to change out when ready)
All new luxury vinyl flooring (waterproof) and baseboards
Upgraded master and guest bathrooms
Ceiling and walls textured and painted
Living room wired for 7.1 surround sound
A large, 234sqft utility/bonus room with brand new water heater
This home is located in the family-oriented community of Port Malabar in Palm Bay, FL. Close to the Indian River, schools, hospital, area shopping and L3 Harris.
Open house Saturday March 19th 10am to 2pm.
Showing by appointment only.
Pre-foreclosure
Est. $211,170
3206 Galleon Ave NE, Palm Bay, FL 32905
3beds
1,500sqft
SingleFamily
Built in 1973
10,018 Square Feet Lot
$-- Zestimate®
$141/sqft
$-- HOA
Overview
- 74 days |
- 142 |
- 8 |
Facts & features
Interior
Bedrooms & bathrooms
- Bedrooms: 3
- Bathrooms: 2
- Full bathrooms: 2
Heating
- Heat pump, Electric
Cooling
- Central
Appliances
- Included: Dishwasher, Microwave, Range / Oven
Features
- Basement: None
Interior area
- Total interior livable area: 1,500 sqft
Property
Parking
- Parking features: Carport, Garage
Features
- Exterior features: Shingle, Stucco, Wood, Cement / Concrete
Lot
- Size: 10,018 Square Feet
Details
- Parcel number: 283725064324
Construction
Type & style
- Home type: SingleFamily
Materials
- Wood
- Roof: Asphalt
Condition
- Year built: 1973
Community & HOA
Location
- Region: Palm Bay
Financial & listing details
- Price per square foot: $141/sqft
- Tax assessed value: $211,170
- Annual tax amount: $3,919
Visit our professional directory to find a foreclosure specialist in your area that can help with your home search.
Find a foreclosure agentForeclosure details
Estimated market value
Not available
Estimated sales range
Not available
$1,980/mo
Price history
Price history
| Date | Event | Price |
|---|---|---|
| 2/5/2026 | Listing removed | $189,000$126/sqft |
Source: | ||
| 12/30/2025 | Price change | $189,000-5%$126/sqft |
Source: | ||
| 12/11/2025 | Price change | $199,000-4.8%$133/sqft |
Source: | ||
| 11/24/2025 | Price change | $209,000-4.6%$139/sqft |
Source: | ||
| 11/6/2025 | Price change | $219,000-4.4%$146/sqft |
Source: | ||
| 10/20/2025 | Price change | $229,000-4.2%$153/sqft |
Source: | ||
| 10/2/2025 | Price change | $239,000-4%$159/sqft |
Source: | ||
| 9/15/2025 | Price change | $249,000-3.9%$166/sqft |
Source: | ||
| 8/29/2025 | Price change | $259,000-3.7%$173/sqft |
Source: | ||
| 8/12/2025 | Listed for sale | $269,000-0.4%$179/sqft |
Source: | ||
| 4/29/2022 | Listing removed | -- |
Source: Owner Report a problem | ||
| 3/29/2022 | Pending sale | $270,000$180/sqft |
Source: Owner Report a problem | ||
| 3/14/2022 | Listed for sale | $270,000+332%$180/sqft |
Source: Owner Report a problem | ||
| 7/3/2001 | Sold | $62,500$42/sqft |
Source: Public Record Report a problem | ||
Public tax history
Public tax history
| Year | Property taxes | Tax assessment |
|---|---|---|
| 2024 | $3,919 -1.9% | $211,170 -0.6% |
| 2023 | $3,995 +49.4% | $212,460 +20.8% |
| 2022 | $2,674 +12% | $175,940 +40.2% |
| 2021 | $2,387 +13.4% | $125,470 +21.6% |
| 2020 | $2,105 -8.4% | $103,220 +1.6% |
| 2019 | $2,299 | $101,640 +162.3% |
| 2018 | $2,299 +367.6% | $38,750 +2.1% |
| 2017 | $492 -2.9% | $37,960 +2.1% |
| 2016 | $507 +58% | $37,180 +0.7% |
| 2015 | $321 -0.1% | $36,930 +0.8% |
| 2014 | $321 | $36,640 -4.7% |
| 2013 | -- | $38,440 +8.3% |
| 2012 | $253 -22.1% | $35,500 -7.7% |
| 2011 | $325 -42.2% | $38,470 -27.5% |
| 2010 | $562 -10.1% | $53,050 -20.1% |
| 2009 | $625 +6% | $66,420 -26% |
| 2008 | $589 -15.7% | $89,700 -21.7% |
| 2007 | $699 -1.3% | $114,600 +25.1% |
| 2005 | $708 -4.2% | $91,640 +48.9% |
| 2004 | $739 -2.1% | $61,560 +5% |
| 2003 | $755 +3.8% | $58,630 +7% |
| 2002 | $727 -35.6% | $54,800 +9.3% |
| 2001 | $1,128 +3% | $50,140 +7.1% |
| 2000 | $1,096 | $46,820 |
Find assessor info on the county website
Monthly payment
Estimated monthly payment
All calculations are estimates and provided by Zillow, Inc. for informational purposes only. Actual amounts may vary.
HOA fees may include property taxes on listings classified as Co-Ops. Contact the listing agent and/or owner for fee details.
Mortgage interest rates are dependent on a number of factors, including credit score, down payment, and repayment length. Interest rate data provided by Zillow Group Marketplace, Inc. as of 1/1/1970 from various mortgage lenders with which we have lead or other similar arrangements; the Estimated Payment is an average of those rates.
See how much you could borrow to make a competitive offer.
Climate risks
Neighborhood: 32905
Nearby schools
GreatSchools rating
- 7/10Palm Bay Elementary SchoolGrades: PK-6Distance: 1.3 mi
- 2/10Palm Bay Magnet Senior High SchoolGrades: PK,8-12Distance: 3.4 mi
- 2/10Stone Magnet Middle SchoolGrades: 7-8Distance: 3.7 mi


- Florida
- Brevard County
- Palm Bay
- 32905
- 3206 Galleon Ave NE
Nearby cities
Nearby zip codes
Other Palm Bay Topics
