Income-producing duplex generating over $60,000 annually. Completely updated and well maintained, this property is located on a quiet, tree-lined street with a wide grassy median in the heart of Biscayne Park. Each unit features 2 full bathrooms, central A/C, open kitchens, and abundant natural light. The property also includes impact windows and ample on-site parking. Both units are in move-in ready condition. Excellent opportunity for investors or owner-occupants seeking rental income in a desirable residential neighborhood.
For sale
Price cut: $70K (8/20)
$925,000
11919 NE 8th Ave, Biscayne Park, FL 33161
4beds
4baths
1,800sqft
Duplex
Built in 1952
-- sqft lot
$-- Zestimate®
$514/sqft
$-- HOA
What's special
Abundant natural lightAmple on-site parkingWide grassy medianOpen kitchensQuiet tree-lined streetImpact windows
- 239 days
- 307
- 18
Zillow last checked:
Listing updated:
Listed by:
Yaacov Poston 305-467-8767,
The Real Estate Lab, Inc.,
Lauren Sencion 305-613-9647,
The Real Estate Lab, Inc.
Source: MIAMI,MLS#: A11969723 Originating MLS: A-Miami Association of REALTORS
Facts & features
Interior
Bedrooms & bathrooms
- Bedrooms: 4
- Bathrooms: 4
Heating
- Central
Cooling
- Ceiling Fan(s), Central Air, Electric
Features
- Flooring: Tile
Interior area
- Total structure area: 1,922
- Total interior livable area: 1,800 sqft
Video & virtual tour
Property
Parking
- Total spaces: 4
Features
- Stories: 1
Lot
- Features: Less Than 1/4 Acre Lot
Details
- Parcel number: 1722300450270
- Zoning: 5900
Construction
Type & style
- Home type: MultiFamily
- Property subtype: Duplex
Materials
- Brick, CBS Construction
- Roof: Barrel Roof
Condition
- Year built: 1952
Utilities & green energy
- Sewer: Septic Tank
Community & HOA
Community
- Subdivision: Griffings Biscayne Pk Est
HOA
- Has HOA: No
Location
- Region: Biscayne Park
Financial & listing details
- Price per square foot: $514/sqft
- Tax assessed value: $764,958
- Annual tax amount: $7,514
- Date on market: 2/26/2026
- Listing terms: All Cash,Conventional
Estimated market value
Not available
Estimated sales range
Not available
Not available
Price history
| Date | Event | Price |
|---|---|---|
| 8/20/2026 | Price change | $925,000-7%$514/sqft |
Source:  MIAMI #A11969723 Report a problem | ||
| 2/26/2026 | Listed for sale | $995,000+33.7%$553/sqft |
Source: MIAMI #A11969723 Report a problem | ||
| 3/13/2023 | Listing removed | -- |
Source: Zillow Rentals Report a problem | ||
| 2/7/2023 | Listed for rent | $3,000$2/sqft |
Source: Zillow Rentals Report a problem | ||
| 9/22/2022 | Sold | $744,000-4%$413/sqft |
Source: MIAMI #A11199218 Report a problem | ||
| 8/30/2022 | Pending sale | $775,000$431/sqft |
Source: MIAMI #A11199218 Report a problem | ||
| 8/10/2022 | Contingent | $775,000$431/sqft |
Source: MIAMI #A11199218 Report a problem | ||
| 7/25/2022 | Price change | $775,000-8.6%$431/sqft |
Source: MIAMI #A11199218 Report a problem | ||
| 7/1/2022 | Price change | $848,000+13.4%$471/sqft |
Source: MIAMI #A11199218 Report a problem | ||
| 6/27/2022 | Listed for sale | $748,000+510.6%$416/sqft |
Source: MIAMI #A11199218 Report a problem | ||
| 7/30/2010 | Sold | $122,500-44.3%$68/sqft |
Source: Public Record Report a problem | ||
| 11/20/2009 | Listing removed | $220,000$122/sqft |
Source: The Keyes Company Realtors #M1342458 Report a problem | ||
| 9/23/2009 | Listed for sale | $220,000-46.3%$122/sqft |
Source: The Keyes Company Realtors #M1342458 Report a problem | ||
| 6/29/2007 | Sold | $410,000+103.4%$228/sqft |
Source: Public Record Report a problem | ||
| 12/29/2006 | Sold | $201,600-21.7%$112/sqft |
Source: Public Record Report a problem | ||
| 12/29/2005 | Sold | $257,500$143/sqft |
Source: Public Record Report a problem | ||
Public tax history
| Year | Property taxes | Tax assessment |
|---|---|---|
| 2025 | $18,122 +6.1% | $648,230 +2.2% |
| 2024 | $17,075 +5% | $633,987 +6.4% |
| 2023 | $16,263 +100.8% | $595,708 +134.4% |
| 2022 | $8,099 +7.8% | $254,125 +10% |
| 2021 | $7,514 +16.8% | $231,023 +10% |
| 2020 | $6,434 +8.5% | $210,021 +10% |
| 2019 | $5,930 +8.2% | $190,929 +10% |
| 2018 | $5,482 | $173,572 +10% |
| 2017 | $5,482 +5.2% | $157,793 +10% |
| 2016 | $5,212 +24% | $143,449 +10% |
| 2015 | $4,204 +3.4% | $130,409 +10% |
| 2014 | $4,067 +35.8% | $118,554 +15.6% |
| 2013 | $2,996 | $102,534 -10.4% |
| 2012 | $2,996 -1.1% | $114,390 -2.1% |
| 2011 | $3,028 -35.9% | $116,842 -12.1% |
| 2010 | $4,724 -34.5% | $132,862 -43.8% |
| 2009 | $7,208 -9.8% | $236,344 -15.2% |
| 2007 | $7,995 +104.7% | $278,726 |
| 2006 | $3,906 | -- |
| 2005 | $3,906 +97.4% | -- |
| 2004 | $1,979 +9.4% | -- |
| 2003 | $1,809 +42% | -- |
| 2002 | $1,274 | -- |
| 2001 | $1,274 | -- |
Find assessor info on the county website
Monthly payment
Est. payment
Payment breakdown
Explore the cost of this home by adjusting the details. Changes won't be saved.Climate risks
Neighborhood: 33161
Similar homes
- $650,0004 bd3 ba1.6k sqftBreezeswept Estates, North Miami, FL 33161For Sale
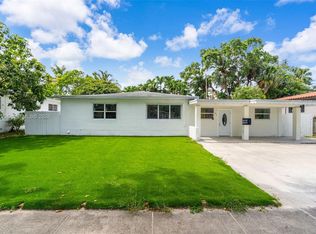
 MLS ID #A11992204, Laura Cresto, Douglas Elliman. MIAMI
- $945,0004 bd3 ba1.6k sqftAlta Vista, Miami, FL 33127For Sale
 MLS ID #A12057382, Hugo Lopez Diaz, My Realty Group, LLC.. MIAMI
- $825,0005 bd4 ba2.2k sqftPleasant Village, Miami, FL 33162For Sale
 MLS ID #A12107893, Helen Orukotan, Element Real Estate Group. MIAMI
- $845,0003 bd2 ba2.2k sqftRev Plat Of Brandon Park, Miami, FL 33169For Sale
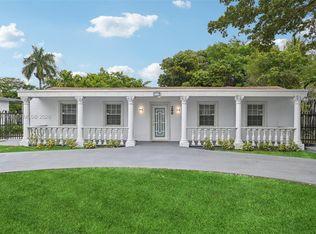 MLS ID #A12106166, Christopher Adeleke, Douglas Elliman. MIAMI
- $1,100,0006 bd6 ba905 sqftFutura Villas No 3 Condo, Miami, FL 33161For SaleMLS ID #A12063154, Linda Guaida, BHHS EWM Realty. MIAMI
- $910,0004 bd4 ba1.8k sqftSun Land Park, Miramar, FL 33023For SaleMLS ID #A11992504, Amir Panjwani, Lifestyle International Realty. MIAMI
- $799,0003 bd4 ba2k sqftReed Land Co, Fort Lauderdale, FL 33312For SaleMLS ID #A12110672, Yoseph Madar, Miami Lifestyle Realty Inc. MIAMI
- $849,0003 bd3 ba965 sqftMonticello Park Unit 1, North Miami Beach, FL 33162For SaleMLS ID #A12096771, Melanie Dayan, Sunny Isles Realty, Inc.. MIAMI
- $675,0004 bd2 ba1.5k sqftAlhambra Heights, North Miami, FL 33168For SaleMLS ID #A12081996, Lanorris Miller, Elite Realty Partners, Inc.. MIAMI
- $995,0003 bd2 ba1.4k sqftEast Shore Crest Sec 2, Miami, FL 33138For SaleMLS ID #A11974974, Ronald Morales Del Castillo, United Realty Group Inc.. MIAMI
- $705,0005 bd2 ba2.1k sqftOleta Terr, Miami, FL 33162For SaleMLS ID #A12060348, Lupita Alonso, Legacy Group Real Estate, LLC.. MIAMI
- $1,049,9003 bd3 ba1.6k sqftEl Portal, El Portal, FL 33138For SaleMLS ID #A11947919, Pierre Elmaleh, Sunstone Brokers. MIAMI
- $799,0005 bd3 ba1.9k sqftPembroke Lakes Sec 6, Pembroke Pines, FL 33026For SaleMLS ID #A12110828, Virginia Schafer, One Sotheby's International Realty. MIAMI
- $489,0002 bd1 ba960 sqftGriffing Biscayne Pk Esta, North Miami, FL 33161For SaleMLS ID #A12097075, Michael Ramirez Garcia, Fortune Christie's Intl R.E.. MIAMI
- $729,9006 bd3 ba2k sqftFairhaven Gardens, Miami, FL 33142For SaleMLS ID #A12106274, Ydalia Rodriguez, Related General Realty, LLC.. MIAMI
- $999,0003 bd2 ba1.6k sqftHighland Lakes, Miami, FL 33180For SaleMLS ID #A12086906, Brigitte Lina, One Sotheby's International Realty. MIAMI
- $1,099,0003 bd4 ba1.8k sqftBayshore Amd, Miami, FL 33137For SaleMLS ID #A12072284, Donald Wilson, Willis Wilson & Associates. MIAMI
- $920,0004 bd4 ba2.2k sqftCrestwood, Miami, FL 33127For SaleMLS ID #A12016478, Nicolas Vicente, Mia MGMT Group, LLC.. MIAMI
- $789,9004 bd3 ba1.8k sqftHollywood Little Ranches, Hollywood, FL 33020For SaleMLS ID #A12088247, Ydalia Rodriguez, Related General Realty, LLC.. MIAMI
- $855,0003 bd2 ba1.4k sqftBay Vista Park Amd Pl, Miami, FL 33127For SaleMLS ID #A12091519, Madyuri Faze, Faze Realty. MIAMI
