This home is situated on a fenced corner lot and is larger than it looks with3 bedrooms, 2 full bathrooms and a partially finished basement! Seller is offering an HSA home warranty for added peace of mind, call today and be home for the holidays!
Active
$159,900
4405 Ingham St, Lansing, MI 48911
3beds
1,785sqft
Single Family Residence
Built in 1970
8,712 Square Feet Lot
$160,100 Zestimate®
$90/sqft
$-- HOA
What's special
Fenced corner lotPartially finished basement
- 14 days
- 464
- 57
Zillow last checked:
Listing updated:
Listed by:
KAYLA DOMINIQUE 517-960-4583,
Howard Hanna Real Estate Services 517-787-9800
Source: MichRIC,MLS#: 26058462
Facts & features
Interior
Bedrooms & bathrooms
- Bedrooms: 3
- Bathrooms: 2
- Full bathrooms: 2
- Main level bedrooms: 3
Heating
- Forced Air
Appliances
- Included: Oven, Refrigerator
- Laundry: In Basement
Features
- Eat-in Kitchen
- Flooring: Vinyl
- Windows: Insulated Windows
- Basement: Full
- Has fireplace: No
Interior area
- Total structure area: 1,195
- Total interior livable area: 1,785 sqft
- Finished area below ground: 590
Property
Parking
- Total spaces: 2
- Parking features: Detached
- Garage spaces: 2
Features
- Stories: 1
- Fencing: Chain Link
Lot
- Size: 8,712 Square Feet
- Dimensions: 104 x 90 x 95 x 89
- Features: Corner Lot, Level
Details
- Parcel number: 33010131428032
- Zoning description: residential
Construction
Type & style
- Home type: SingleFamily
- Architectural style: Ranch
- Property subtype: Single Family Residence
Materials
- Aluminum Siding, Brick
- Roof: Shingle
Condition
- New construction: No
- Year built: 1970
Utilities & green energy
- Sewer: Public Sewer
- Water: Public
- Utilities for property: Natural Gas Connected
Community & HOA
Location
- Region: Lansing
Financial & listing details
- Price per square foot: $90/sqft
- Tax assessed value: $82,776
- Annual tax amount: $5,225
- Date on market: 11/4/2026
- Listing terms: Cash,FHA,VA Loan,MSHDA,Conventional
- Road surface type: Paved
Estimated market value
$160,100
$152,000 - $168,000
$1,866/mo
Price history
| Date | Event | Price |
|---|---|---|
| 11/4/2026 | Listed for sale | $159,900-8.6%$90/sqft |
Source:  MichRIC #26058462 Report a problem | ||
| 7/16/2024 | Sold | $175,000$98/sqft |
Source:  Greater Lansing AOR #278554 Report a problem | ||
| 6/24/2024 | Contingent | $175,000$98/sqft |
Source: Greater Lansing AOR #278554 Report a problem | ||
| 6/20/2024 | Listed for sale | $175,000$98/sqft |
Source: Greater Lansing AOR #278554 Report a problem | ||
| 4/29/2024 | Contingent | $175,000$98/sqft |
Source: Greater Lansing AOR #278554 Report a problem | ||
| 4/25/2024 | Listed for sale | $175,000$98/sqft |
Source: Greater Lansing AOR #278554 Report a problem | ||
| 2/13/2024 | Listing removed | -- |
Source: Greater Lansing AOR #278554 Report a problem | ||
| 2/12/2024 | Listed for sale | $175,000+113.4%$98/sqft |
Source: Greater Lansing AOR #278554 Report a problem | ||
| 1/23/2019 | Sold | $82,000+2.6%$46/sqft |
Source: Greater Lansing AOR #231976 Report a problem | ||
| 11/8/2018 | Listed for sale | $79,900+14.3%$45/sqft |
Source: Keller Williams Realty Lansing-East #231976 Report a problem | ||
| 6/24/2016 | Listing removed | $69,900$39/sqft |
Source: Keller Williams - Lansing #78504 Report a problem | ||
| 2/26/2016 | Price change | $69,900-6.7%$39/sqft |
Source: Keller Williams - Lansing #78504 Report a problem | ||
| 2/1/2016 | Listed for sale | $74,900-6.3%$42/sqft |
Source: Keller Williams Realty Lansing-East #78504 Report a problem | ||
| 10/24/2010 | Listing removed | $79,900$45/sqft |
Source: Coldwell Banker Hubbell Briarwood #12766 Report a problem | ||
| 7/17/2010 | Price change | $79,900-2.6%$45/sqft |
Source: Coldwell Banker Hubbell Briarwood #12766 Report a problem | ||
| 5/12/2010 | Price change | $82,000-3.4%$46/sqft |
Source: Coldwell Banker Hubbell Briarwood #12766 Report a problem | ||
| 4/29/2010 | Listed for sale | $84,900+2.4%$48/sqft |
Source: Coldwell Banker Hubbell Briarwood #12766 Report a problem | ||
| 5/25/2009 | Listing removed | $82,900$46/sqft |
Source: Coldwell Banker** #183466 Report a problem | ||
| 2/24/2009 | Price change | $82,900-7.8%$46/sqft |
Source: Coldwell Banker** #183466 Report a problem | ||
| 1/18/2009 | Price change | $89,900-3.2%$50/sqft |
Source: Coldwell Banker** #183466 Report a problem | ||
| 11/30/2008 | Listed for sale | $92,900+151.1%$52/sqft |
Source: Coldwell Banker** #183466 Report a problem | ||
| 3/28/2008 | Sold | $37,000-48.3%$21/sqft |
Source: Public Record Report a problem | ||
| 3/16/2007 | Sold | $71,629$40/sqft |
Source: Public Record Report a problem | ||
Public tax history
| Year | Property taxes | Tax assessment |
|---|---|---|
| 2025 | $3,371 +6.7% | $80,600 +19.9% |
| 2024 | $3,160 | $67,200 +19.1% |
| 2023 | -- | $56,400 +12.8% |
| 2022 | -- | $50,000 +4.2% |
| 2021 | -- | $48,000 +6.9% |
| 2020 | -- | $44,900 +18.8% |
| 2019 | $2,237 | $37,800 +18.5% |
| 2018 | $2,237 +3.3% | $31,900 |
| 2017 | $2,166 | $31,900 +6.3% |
| 2016 | $2,166 | $30,000 +3.4% |
| 2015 | $2,166 | $29,000 +0.7% |
| 2014 | $2,166 | $28,800 -3.4% |
| 2013 | -- | $29,800 -7.5% |
| 2012 | -- | $32,200 -12% |
| 2011 | -- | $36,600 -14.3% |
| 2010 | -- | $42,700 -10.7% |
| 2009 | -- | $47,800 -10.3% |
| 2008 | -- | $53,300 -4.8% |
| 2007 | -- | $56,000 +2% |
| 2006 | -- | $54,900 +4.2% |
| 2005 | -- | $52,700 +8.7% |
| 2004 | -- | $48,500 +18.9% |
| 2003 | -- | $40,800 +7.9% |
| 2002 | -- | $37,800 +8.3% |
| 2001 | -- | $34,900 +4.8% |
| 2000 | -- | $33,300 |
Find assessor info on the county website
Monthly payment
Est. payment
Payment breakdown
Explore the cost of this home by adjusting the details. Changes won't be saved.Climate risks
Neighborhood: 48911
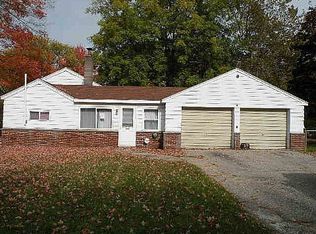
Similar homes
- $159,9004 bd2 ba1.3k sqft3620 Pleasant Grove Rd, Lansing, MI 48910For Sale
 MLS ID #300035, Mara Tomic Bobas, Mara Realty. Greater Lansing AOR
- $125,0003 bd1 ba1.3k sqft3434 Glenbrook Dr, Lansing, MI 48911For Sale

 MLS ID #26056991, Sunem Romero, CENTURY 21 Affiliated. MichRIC
- $150,0003 bd1 ba1k sqft1420 Reo Rd, Lansing, MI 48910For Sale
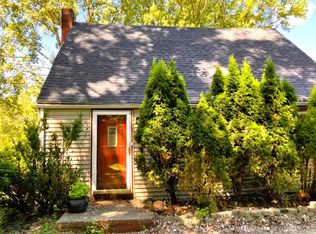 MLS ID #25036096, Rene Guzman, 1st Advantage Realty. MichRIC
- $154,9003 bd2 ba1.7k sqft2626 Forest Rd, Lansing, MI 48910For Sale
 MLS ID #297949, Missy Lord, RE/MAX Real Estate Professionals Dewitt. Greater Lansing AOR
- $105,0003 bd1 ba894 sqft2905 Fielding Dr, Lansing, MI 48911For SaleMLS ID #26055643, Scott M Minnich, Epique Realty. MichRIC
- $119,9004 bd2 ba1k sqft611 W Miller Rd, Lansing, MI 48911For Sale
 MLS ID #50223254, Julie Klawuhn, Richard Selleck Agency. MiRealSource
- $169,9993 bd1 ba1k sqft3242 Tenny St, Lansing, MI 48910For SaleMLS ID #26051305, Frank Jajou, BHHS Kee Realty. MichRIC
- $153,0003 bd1 ba900 sqft1849 Osband Ave, Lansing, MI 48910For SaleMLS ID #26047024, Jeremy Vincent, Vincent Realty Group Inc.. MichRIC
- $127,4003 bd1 ba932 sqft6445 Sommerset Rd, Lansing, MI 48911For SaleMLS ID #26047631, Jeffrey Glover, Glover Agency REALTORS. MichRIC
- $129,9003 bd2 ba1k sqft619 E Mount Hope Ave, Lansing, MI 48910For SaleMLS ID #26059545, Alicia Lease, Community Choice Realty. MichRIC
- $159,9003 bd3 ba1k sqft1805 W Saginaw St, Lansing, MI 48915For SaleMLS ID #50212429, Megan Alfaro, Real Estate One Monroe. MiRealSource
