Property Vacant. Please contact LA for more details
For sale
$490,000
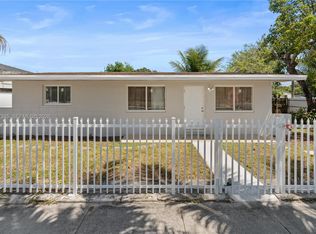
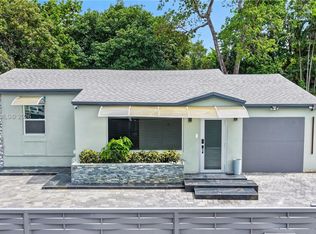
1739 NW 67th St, Miami, FL 33147
3beds
812sqft
Single Family Residence
Built in 1947
3,600 Square Feet Lot
$479,800 Zestimate®
$603/sqft
$-- HOA
What's special
- 2 days |
- 175 |
- 12 |
Likely to sell faster than
Zillow last checked:
Listing updated:
Listed by:
Miguel Mahecha 305-781-5765,
Avanti Way Realty LLC
Source: MIAMI,MLS#: A12036512 Originating MLS: A-Miami Association of REALTORS
Loading...
Facts & features
Interior
Bedrooms & bathrooms
- Bedrooms: 3
- Bathrooms: 2
- Full bathrooms: 2
Rooms
- Room types: Den/Library/Office
Heating
- Central
Cooling
- Central Air
Appliances
- Included: Dryer, Microwave, Refrigerator, Washer
Features
- Flooring: Ceramic Tile
Interior area
- Total structure area: 914
- Total interior livable area: 812 sqft
Video & virtual tour
Property
Parking
- Total spaces: 4
- Parking features: Additional Spaces Available, Driveway
- Garage spaces: 4
- Has uncovered spaces: Yes
Features
- Stories: 1
- Entry location: First Floor Entry
- Exterior features: Lighting
- Pool features: R30-No Pool/No Water
- Has view: Yes
- View description: None
Lot
- Size: 3,600 Square Feet
- Features: Less Than 1/4 Acre Lot, 1/4 To Less Than 1/2 Acre Lot
Details
- Parcel number: 3031150051620
- Zoning: 5700
Construction
Type & style
- Home type: SingleFamily
- Property subtype: Single Family Residence
Materials
- Concrete Block Construction, Brick
- Roof: Flat Tile
Condition
- Year built: 1947
Utilities & green energy
- Sewer: Public Sewer
- Water: Municipal Water
Community & HOA
Community
- Features: Game Room
- Subdivision: Liberty City
HOA
- Has HOA: No
Location
- Region: Miami
Financial & listing details
- Price per square foot: $603/sqft
- Tax assessed value: $270,823
- Annual tax amount: $5,092
- Date on market: 6/12/2026
- Listing terms: Conventional,FHA,VA Loan
Estimated market value
$479,800
$456,000 - $504,000
$2,845/mo
Price history
| Date | Event | Price |
|---|---|---|
| 6/13/2026 | Listed for sale | $490,000+14%$603/sqft |
Source: | ||
| 3/19/2026 | Listing removed | $2,900$4/sqft |
Source: | ||
| 3/11/2026 | Price change | $2,900-3.3%$4/sqft |
Source: | ||
| 2/23/2026 | Listed for rent | $3,000$4/sqft |
Source: | ||
| 4/24/2024 | Sold | $430,000$530/sqft |
Source: | ||
| 3/15/2024 | Pending sale | $430,000$530/sqft |
Source: | ||
| 3/5/2024 | Listed for sale | $430,000$530/sqft |
Source: | ||
| 3/3/2024 | Contingent | $430,000$530/sqft |
Source: | ||
| 3/2/2024 | Listed for sale | $430,000$530/sqft |
Source: | ||
| 2/19/2024 | Contingent | $430,000$530/sqft |
Source: | ||
| 2/15/2024 | Listed for sale | $430,000+104.8%$530/sqft |
Source: | ||
| 9/14/2023 | Sold | $210,000-2.3%$259/sqft |
Source: | ||
| 5/6/2023 | Pending sale | $215,000$265/sqft |
Source: | ||
| 5/5/2023 | Listed for sale | $215,000+42900%$265/sqft |
Source: | ||
| 8/12/2021 | Sold | $500-99.6%$1/sqft |
Source: Public Record Report a problem | ||
| 3/14/2005 | Sold | $118,000+68.6%$145/sqft |
Source: Public Record Report a problem | ||
| 5/27/2004 | Sold | $70,000+7.7%$86/sqft |
Source: Public Record Report a problem | ||
| 11/16/2001 | Sold | $65,000+48.1%$80/sqft |
Source: Public Record Report a problem | ||
| 10/2/2000 | Sold | $43,900+38.9%$54/sqft |
Source: Public Record Report a problem | ||
| 5/18/2000 | Sold | $31,600-49.3%$39/sqft |
Source: Public Record Report a problem | ||
| 3/16/1999 | Sold | $62,300+19.8%$77/sqft |
Source: Public Record Report a problem | ||
| 7/23/1996 | Sold | $52,000+420%$64/sqft |
Source: Public Record Report a problem | ||
| 1/9/1996 | Sold | $10,000$12/sqft |
Source: Public Record Report a problem | ||
Public tax history
| Year | Property taxes | Tax assessment |
|---|---|---|
| 2025 | $5,305 +29.2% | $270,823 +35.3% |
| 2024 | $4,106 +12.1% | $200,102 +14.8% |
| 2023 | $3,662 +13.4% | $174,344 +10% |
| 2022 | $3,228 +59.6% | $158,495 +132.6% |
| 2021 | $2,022 +10.1% | $68,129 +10% |
| 2020 | $1,836 +6.2% | $61,936 +10% |
| 2019 | $1,729 +17.6% | $56,306 +10% |
| 2018 | $1,470 | $51,188 +10% |
| 2017 | $1,470 +12.7% | $46,535 +10% |
| 2016 | $1,305 +10% | $42,305 +5.9% |
| 2015 | $1,186 +4.4% | $39,965 +10% |
| 2014 | $1,136 -6.5% | $36,332 +2% |
| 2013 | $1,215 | $35,613 -13.4% |
| 2012 | $1,215 -8.3% | $41,114 -11.9% |
| 2011 | $1,325 -25.4% | $46,644 -27.8% |
| 2010 | $1,776 -5.9% | $64,616 -15.1% |
| 2009 | $1,888 -26.1% | $76,119 -32.8% |
| 2007 | $2,556 +41.4% | $113,225 |
| 2006 | $1,808 | -- |
| 2005 | $1,808 +68.5% | -- |
| 2004 | $1,073 +9.3% | -- |
| 2003 | $982 -2.4% | -- |
| 2002 | $1,006 | -- |
| 2001 | $1,006 | -- |
Find assessor info on the county website
Monthly payment
Est. payment$--/mo
Payment breakdown
Explore the cost of this home by adjusting the details. Changes won't be saved.All calculations are estimates and provided by Zillow, Inc. for informational purposes only. Actual amounts may vary.
HOA fees may include property taxes on listings classified as Co-Ops. Contact the listing agent and/or owner for fee details.
Mortgage interest rates are dependent on a number of factors, including credit score, down payment, and repayment length. Interest rate data provided by Zillow Group Marketplace, Inc. as of 1/1/1970 from various mortgage lenders with which we have lead or other similar arrangements; the Estimated Payment is an average of those rates.
See how much you could borrow to make a competitive offer.
Climate risks
Neighborhood: 33147
Nearby schools
GreatSchools rating
- 6/10Liberty City Elementary SchoolGrades: PK-5Distance: 0.3 mi
- 3/10Brownsville Middle SchoolGrades: 6-8Distance: 1.2 mi
- 2/10Miami Northwestern Senior High SchoolGrades: 9-12Distance: 0.8 mi
Schools provided by the listing agent
- Elementary: Liberty City
- Middle: Brownsville
Source: MIAMI. This data may not be complete. We recommend contacting the local school district to confirm school assignments for this home.

A local agent can set up tours, give advice and negotiate with sellers.


- Florida
- Miami-Dade County
- Gladeview
- 33147
- 1739 NW 67th St
Nearby cities
Nearby zip codes
Other Gladeview Topics
