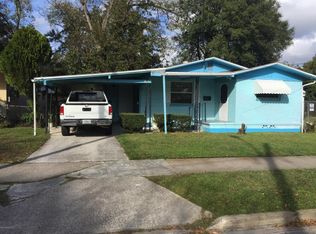
This 936 square foot single family home has 3 bedrooms and 1.0 bathrooms. This home is located at 1819 W 25th St, Jacksonville, FL 32209.
Pre-foreclosure
Est. $84,733
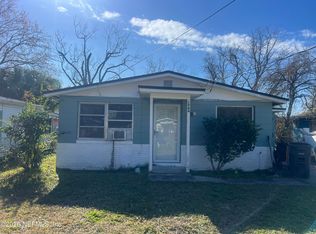
1819 W 25th St, Jacksonville, FL 32209
3beds
1baths
936sqft
SingleFamily
Built in 1963
5,000 Square Feet Lot
$-- Zestimate®
$91/sqft
$-- HOA
Overview
- 223 days |
- 16 |
- 0 |
Facts & features
Interior
Bedrooms & bathrooms
- Bedrooms: 3
- Bathrooms: 1
Heating
- Forced air, Electric
Cooling
- Central
Appliances
- Included: Range / Oven, Refrigerator
Features
- Flooring: Softwood, Hardwood
- Has fireplace: Yes
Interior area
- Total interior livable area: 936 sqft
Property
Parking
- Total spaces: 1
- Parking features: None
Features
- Exterior features: Cement / Concrete
Lot
- Size: 5,000 Square Feet
Details
- Parcel number: 0872260000
Construction
Type & style
- Home type: SingleFamily
Materials
- Roof: Asphalt
Condition
- Year built: 1963
Community & HOA
Location
- Region: Jacksonville
Financial & listing details
- Price per square foot: $91/sqft
- Tax assessed value: $84,733
- Annual tax amount: $1,726
Visit our professional directory to find a foreclosure specialist in your area that can help with your home search.
Find a foreclosure agentForeclosure details
Estimated market value
Not available
Estimated sales range
Not available
$1,166/mo
Price history
Price history
| Date | Event | Price |
|---|---|---|
| 2/2/2026 | Listing removed | $121,500$130/sqft |
Source: | ||
| 10/24/2025 | Price change | $121,500-1.2%$130/sqft |
Source: | ||
| 9/3/2025 | Price change | $123,000-6.1%$131/sqft |
Source: | ||
| 5/7/2025 | Price change | $131,000-13.2%$140/sqft |
Source: | ||
| 1/21/2025 | Listed for sale | $151,000+332.4%$161/sqft |
Source: | ||
| 11/28/2022 | Listing removed | -- |
Source: Zillow Rental Network Premium Report a problem | ||
| 11/7/2022 | Price change | $945-13.7%$1/sqft |
Source: Zillow Rental Network Premium #1193887 Report a problem | ||
| 10/17/2022 | Price change | $1,095-4.4%$1/sqft |
Source: Zillow Rental Network Premium #1193887 Report a problem | ||
| 10/14/2022 | Price change | $1,145-4.2%$1/sqft |
Source: Zillow Rental Network Premium #1193887 Report a problem | ||
| 9/30/2022 | Listed for rent | $1,195+29.2%$1/sqft |
Source: Zillow Rental Network Premium Report a problem | ||
| 5/7/2022 | Sold | $34,923-0.2%$37/sqft |
Source: Public Record Report a problem | ||
| 5/26/2020 | Listing removed | $925$1/sqft |
Source: Go Section8 Report a problem | ||
| 4/21/2020 | Price change | $925+5.7%$1/sqft |
Source: Go Section8 Report a problem | ||
| 4/2/2020 | Price change | $875-2.8%$1/sqft |
Source: SUNCOAST PROPERTY MANAGEMENT LLC #1043277 Report a problem | ||
| 3/25/2020 | Price change | $900-2.7%$1/sqft |
Source: SUNCOAST PROPERTY MANAGEMENT LLC #1043277 Report a problem | ||
| 3/13/2020 | Listed for rent | $925+9.5%$1/sqft |
Source: SUNCOAST PROPERTY MANAGEMENT LLC #1043277 Report a problem | ||
| 2/8/2019 | Listing removed | $845$1/sqft |
Source: Zillow Rental Network Report a problem | ||
| 11/30/2018 | Listed for rent | $845$1/sqft |
Source: Zillow Rental Network Report a problem | ||
| 4/28/2017 | Sold | $35,000$37/sqft |
Source: | ||
Public tax history
Public tax history
| Year | Property taxes | Tax assessment |
|---|---|---|
| 2024 | $1,726 +3.6% | $84,733 +4.6% |
| 2023 | $1,666 +84.5% | $80,978 +110.8% |
| 2022 | $903 +9.7% | $38,415 +10% |
| 2021 | $823 +1.9% | $34,923 +3.2% |
| 2020 | $808 +9.9% | $33,852 +9.4% |
| 2019 | $735 +1% | $30,951 +2.2% |
| 2018 | $728 | $30,291 +7.9% |
| 2017 | $728 +9.4% | $28,085 +20.4% |
| 2016 | $665 +8.2% | $23,321 -0.6% |
| 2015 | $615 -1.6% | $23,461 +11.5% |
| 2014 | $625 | $21,033 +6.8% |
| 2013 | -- | $19,701 -22% |
| 2012 | -- | $25,261 -55.3% |
| 2011 | -- | $56,542 -9.4% |
| 2010 | -- | $62,429 -8.9% |
| 2009 | -- | $68,491 +19.6% |
| 2006 | -- | $57,280 +12.1% |
| 2005 | $949 | $51,100 +8% |
| 2004 | -- | $47,300 +3.3% |
| 2003 | $888 | $45,800 +18.3% |
| 2002 | -- | $38,700 +1.8% |
| 2001 | -- | $38,000 +45.9% |
| 2000 | -- | $26,050 +1.6% |
| 1999 | -- | $25,650 |
Find assessor info on the county website
BuyAbility℠ payment
Estimated monthly payment
Boost your down payment with 6% savings match
Earn up to a 6% match & get a competitive APY with a *. Zillow has partnered with to help get you home faster.
Learn more*Terms apply. Match provided by Foyer. Account offered by Pacific West Bank, Member FDIC.Climate risks
Neighborhood: Moncrief Park
Nearby schools
GreatSchools rating
- 2/10George Washington Carver Elementary SchoolGrades: PK-5Distance: 1.5 mi
- 2/10Matthew W. Gilbert Middle SchoolGrades: 6-8Distance: 3.1 mi
- 2/10William M. Raines High SchoolGrades: 9-12Distance: 2.1 mi