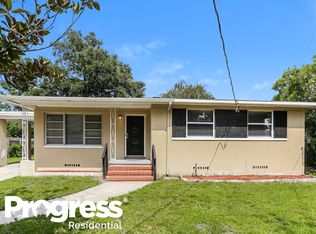
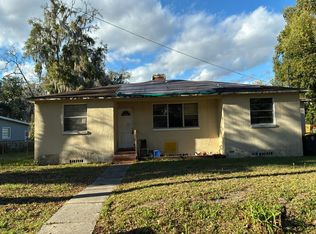
Totally redone CONCRETE BLOCK w decorative siding on top. Inside has Tile Kitchen and Baths, New Carpet in Living Room, Refinished Wood Floors Throughout, New Lighting, Huge Screened Porch, Fenced Yard, Workshop, Covered Carport, Tons of Character, Tile Counter Tops and Back Splash, New Metal Roof and Great Landscape! HOME WARRANTY Included-Feels much larger than listed square feet.
Foreclosed
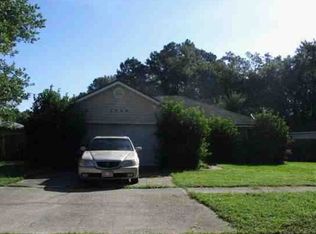
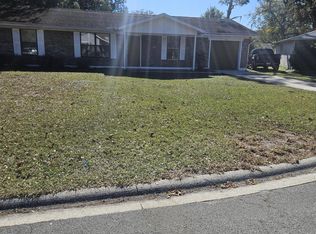
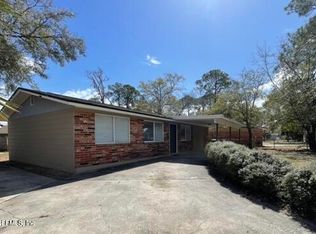
Street View
Est. $205,500
5235 Batley Rd, Jacksonville, FL 32210
3beds
1baths
936sqft
SingleFamily
Built in 1958
8,250 Square Feet Lot
$205,500 Zestimate®
$220/sqft
$-- HOA
Overview
- 19 days |
- 39 |
- 0 |
Facts & features
Interior
Bedrooms & bathrooms
- Bedrooms: 3
- Bathrooms: 1.5
Heating
- Forced air, Electric
Cooling
- Central
Features
- Flooring: Carpet, Hardwood
- Has fireplace: Yes
Interior area
- Total interior livable area: 936 sqft
Property
Parking
- Parking features: Carport
Features
- Exterior features: Other
Lot
- Size: 8,250 Square Feet
Details
- Parcel number: 0960490000
Construction
Type & style
- Home type: SingleFamily
Materials
- Roof: Metal
Condition
- Year built: 1958
Community & HOA
Location
- Region: Jacksonville
Financial & listing details
- Price per square foot: $220/sqft
- Tax assessed value: $156,305
- Annual tax amount: $3,004
Visit our professional directory to find a foreclosure specialist in your area that can help with your home search.
Find a foreclosure agentForeclosure details
Estimated market value
$205,500
$193,000 - $218,000
$1,427/mo
Price history
Price history
| Date | Event | Price |
|---|---|---|
| 3/16/2026 | Sold | $116,600-43.1%$125/sqft |
Source: Public Record Report a problem | ||
| 9/2/2022 | Sold | $205,000+3.5%$219/sqft |
Source: | ||
| 7/19/2022 | Pending sale | $198,000$212/sqft |
Source: | ||
| 7/1/2022 | Listed for sale | $198,000+15.6%$212/sqft |
Source: | ||
| 6/26/2022 | Sold | $171,300-18.4%$183/sqft |
Source: Public Record Report a problem | ||
| 6/9/2022 | Listed for sale | $210,000+172.7%$224/sqft |
Source: | ||
| 11/3/2009 | Sold | $77,000-3.1%$82/sqft |
Source: Public Record Report a problem | ||
| 9/27/2009 | Price change | $79,500-6.2%$85/sqft |
Source: ZIP REALTY, INC. #497070 Report a problem | ||
| 9/19/2009 | Price change | $84,750-0.3%$91/sqft |
Source: ZIP REALTY, INC. #497070 Report a problem | ||
| 9/16/2009 | Price change | $85,000-4%$91/sqft |
Source: ZIP REALTY, INC. #497070 Report a problem | ||
| 8/27/2009 | Price change | $88,500-6.8%$95/sqft |
Source: ZIP REALTY, INC. #497070 Report a problem | ||
| 8/16/2009 | Listed for sale | $95,000+179.4%$101/sqft |
Source: ZIP REALTY, INC. #497070 Report a problem | ||
| 7/22/2009 | Sold | $34,000+3.3%$36/sqft |
Source: Public Record Report a problem | ||
| 6/27/2009 | Price change | $32,900-41.3%$35/sqft |
Source: CENTURY 21 Lighthouse Realty #484957 Report a problem | ||
| 5/15/2009 | Listed for sale | -- |
Source: foreclosure.com Report a problem | ||
| 2/2/2001 | Sold | $56,000$60/sqft |
Source: Public Record Report a problem | ||
Public tax history
Public tax history
| Year | Property taxes | Tax assessment |
|---|---|---|
| 2024 | $3,004 -0.4% | $156,305 +0.1% |
| 2023 | $3,016 +26.6% | $156,190 +22.6% |
| 2022 | $2,382 +494.4% | $127,423 +125.7% |
| 2021 | $401 -41.5% | $56,452 +1.4% |
| 2020 | $685 0% | $55,673 +2.3% |
| 2019 | $686 +0.3% | $54,422 +1.9% |
| 2018 | $684 | $53,408 +2.1% |
| 2017 | $684 +0.2% | $52,310 +2.1% |
| 2016 | $683 -0.3% | $51,235 +2.1% |
| 2015 | $684 -0.1% | $50,160 +0.8% |
| 2014 | $685 | $49,762 +1.5% |
| 2013 | -- | $49,027 -23.1% |
| 2012 | -- | $63,728 -4.7% |
| 2011 | -- | $66,843 -15.3% |
| 2010 | -- | $78,903 +21.5% |
| 2009 | -- | $64,958 +5.7% |
| 2006 | -- | $61,467 +3% |
| 2005 | $644 | $59,677 +3% |
| 2004 | -- | $57,939 +1.9% |
| 2003 | $618 | $56,859 +2.4% |
| 2002 | -- | $55,526 +25.8% |
| 2001 | -- | $44,133 +2.5% |
| 2000 | -- | $43,058 +2.7% |
| 1999 | -- | $41,926 |
Find assessor info on the county website
Monthly payment
Estimated monthly payment
All calculations are estimates and provided by Zillow, Inc. for informational purposes only. Actual amounts may vary.
HOA fees may include property taxes on listings classified as Co-Ops. Contact the listing agent and/or owner for fee details.
Mortgage interest rates are dependent on a number of factors, including credit score, down payment, and repayment length. Interest rate data provided by Zillow Group Marketplace, Inc. as of 1/1/1970 from various mortgage lenders with which we have lead or other similar arrangements; the Estimated Payment is an average of those rates.
See how much you could borrow to make a competitive offer.
Climate risks
Neighborhood: Cedar Hills
Nearby schools
GreatSchools rating
- 4/10Cedar Hills Elementary SchoolGrades: K-5Distance: 0.6 mi
- 2/10J. E. B. Stuart Middle SchoolGrades: 6-8Distance: 0.8 mi
- 2/10Westside High SchoolGrades: 9-12Distance: 0.9 mi
- Florida
- Duval County
- Jacksonville
- 32210
- Cedar Hills
- 5235 Batley Rd
Nearby cities
Nearby neighborhoods
Nearby zip codes
Other Jacksonville Topics
