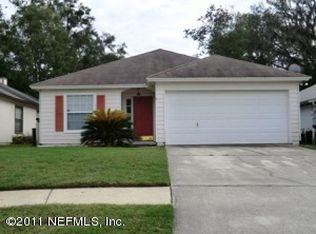
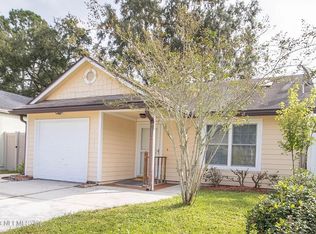
Well located home close to everything! Eat-in kitchen, large great room, w/vaulted ceilings, master bath has double vanity sinks, garden tub. This is a great home at a great price. Lawn maintenance and Exterior Painting included in monthly Association Fee.
Foreclosed
Est. $234,400
5562 Oak Crossing Dr, Jacksonville, FL 32244
3beds
1,372sqft
SingleFamily
Built in 1996
6,737 Square Feet Lot
$234,400 Zestimate®
$171/sqft
$4/mo HOA
Overview
- 184 days |
- 94 |
- 5 |
Facts & features
Interior
Bedrooms & bathrooms
- Bedrooms: 3
- Bathrooms: 2
- Full bathrooms: 2
Heating
- None, Other
Cooling
- Central
Appliances
- Included: Dishwasher, Microwave, Range / Oven, Refrigerator
Features
- Flooring: Other
Interior area
- Total interior livable area: 1,372 sqft
Property
Parking
- Total spaces: 2
- Parking features: Garage - Attached
Features
- Exterior features: Vinyl
- Fencing: Wood Fencing, Fenced Rear
Lot
- Size: 6,737 Square Feet
Details
- Parcel number: 0991355055
Construction
Type & style
- Home type: SingleFamily
Materials
- Roof: Shake / Shingle
Condition
- Year built: 1996
Utilities & green energy
- Utilities for property: Water - Public, Sewer - Public
Community & HOA
HOA
- Has HOA: Yes
- HOA fee: $4 monthly
Location
- Region: Jacksonville
Financial & listing details
- Price per square foot: $171/sqft
- Tax assessed value: $207,204
- Annual tax amount: $1,794
Visit our professional directory to find a foreclosure specialist in your area that can help with your home search.
Find a foreclosure agentForeclosure details
Estimated market value
$234,400
$211,000 - $253,000
$1,674/mo
Price history
Price history
| Date | Event | Price |
|---|---|---|
| 9/30/2025 | Sold | $161,700+79.7%$118/sqft |
Source: Public Record Report a problem | ||
| 9/5/2025 | Listed for sale | $90,000-37.9%$66/sqft |
Source: | ||
| 9/17/2018 | Sold | $145,000+3.6%$106/sqft |
Source: | ||
| 8/9/2018 | Pending sale | $139,900$102/sqft |
Source: SELLSTATE HIGH PERFORMANCE REALTY #947910 Report a problem | ||
| 8/4/2018 | Listed for sale | $139,900$102/sqft |
Source: SELLSTATE HIGH PERFORMANCE REALTY #947910 Report a problem | ||
| 7/23/2018 | Pending sale | $139,900$102/sqft |
Source: SELLSTATE HIGH PERFORMANCE REALTY #947910 Report a problem | ||
| 7/23/2018 | Listed for sale | $139,900+81.7%$102/sqft |
Source: SELLSTATE HIGH PERFORMANCE REALTY #947910 Report a problem | ||
| 11/26/2013 | Sold | $77,000+1.3%$56/sqft |
Source: | ||
| 10/6/2013 | Price change | $76,000-6.2%$55/sqft |
Source: Coldwell Banker Vanguard Realty, Inc. #682145 Report a problem | ||
| 9/4/2013 | Listed for sale | $81,000-42.1%$59/sqft |
Source: Vanguard Realty, Inc. #682145 Report a problem | ||
| 9/26/2005 | Sold | $139,900+80.5%$102/sqft |
Source: Public Record Report a problem | ||
| 9/23/1996 | Sold | $77,500$56/sqft |
Source: Public Record Report a problem | ||
Public tax history
Public tax history
| Year | Property taxes | Tax assessment |
|---|---|---|
| 2024 | $1,794 +3.4% | $130,691 +3% |
| 2023 | $1,735 +10% | $126,885 +3% |
| 2022 | $1,577 +1.3% | $123,190 +3% |
| 2021 | $1,557 +1.3% | $119,602 +1.4% |
| 2020 | $1,538 -1.3% | $117,951 +0.1% |
| 2019 | $1,559 -22.2% | $117,803 +21% |
| 2018 | $2,004 | $97,333 -0.8% |
| 2017 | $2,004 +7.2% | $98,117 +14.1% |
| 2016 | $1,869 +8.4% | $86,020 +17.6% |
| 2015 | $1,725 +9.5% | $73,129 +6% |
| 2014 | $1,575 | $68,996 +6.5% |
| 2013 | -- | $64,794 -3.2% |
| 2012 | -- | $66,921 -28.7% |
| 2011 | -- | $93,794 -9.3% |
| 2010 | -- | $103,412 -17.2% |
| 2009 | -- | $124,943 +4.2% |
| 2006 | -- | $119,943 +41.1% |
| 2005 | $1,115 | $85,015 +3% |
| 2004 | -- | $82,539 +1.9% |
| 2003 | $1,086 | $81,000 +1.8% |
| 2002 | -- | $79,600 +1.3% |
| 2001 | -- | $78,600 -3.6% |
| 2000 | -- | $81,499 +2.7% |
| 1999 | -- | $79,356 |
Find assessor info on the county website
Monthly payment
Estimated monthly payment
All calculations are estimates and provided by Zillow, Inc. for informational purposes only. Actual amounts may vary.
HOA fees may include property taxes on listings classified as Co-Ops. Contact the listing agent and/or owner for fee details.
Mortgage interest rates are dependent on a number of factors, including credit score, down payment, and repayment length. Interest rate data provided by Zillow Group Marketplace, Inc. as of 1/1/1970 from various mortgage lenders with which we have lead or other similar arrangements; the Estimated Payment is an average of those rates.
See how much you could borrow to make a competitive offer.
Climate risks
Neighborhood: Ortega Hills
Nearby schools
GreatSchools rating
- 5/10Venetia Elementary SchoolGrades: K-5Distance: 3.9 mi
- 2/10J. E. B. Stuart Middle SchoolGrades: 6-8Distance: 4.1 mi
- 3/10Robert E. Lee High SchoolGrades: 9-12Distance: 7.7 mi


- Florida
- Duval County
- Jacksonville
- 32244
- Ortega Hills
- 5562 Oak Crossing Dr
Nearby cities
Nearby neighborhoods
Nearby zip codes
Other Jacksonville Topics
