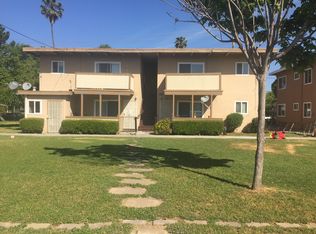
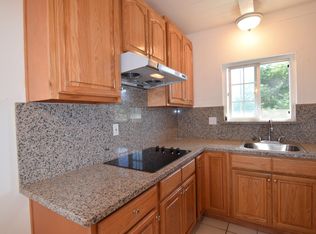
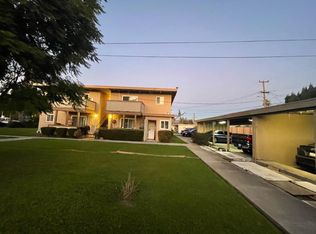
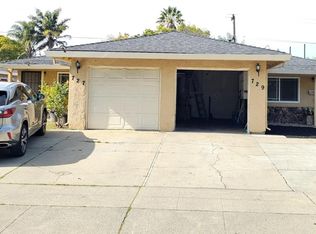
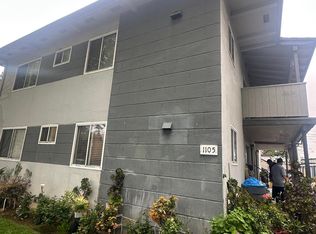
Fully Rented 4-Plex Investment Opportunity with Upside Potential! This well-maintained 4-unit building is a great addition to any investor's portfolio. Located in a safe and convenient neighborhood, the property offers consistent rental demand, long-term tenants, and room to grow your profits. Property Highlights: Unit Configuration: Four units (4x 2-bed/1-bath) ideal for owner-occupied buyers or for investors Well-Maintained Community: Lewis Road is part of an HOA that ensures clean and well-kept grounds. Parking & Amenities: Includes assigned carports with extra parking spots, a shared laundry facility, and balconies/patios for tenant enjoyment. Prime Convenience: Close to major employers, shopping, dining, schools, churches, and public transportation, making it a practical choice for families and ensuring steady rental income and high occupancy rates. Value-Add Potential: Some units need upgrades, offering an opportunity to increase profitability through market rent adjustments or cosmetic improvements to boost appeal. This property is a solid investment for seasoned investors or first-time buyers entering the multi-family market. Schedule your private tour today and discover why this property is the perfect fit for your portfolio!
For sale
$1,550,000
450 Lewis Rd, San Jose, CA 95111
8beds
3,328sqft
Est.: Get pre-qualified
Multi Family
Built in 1962
-- sqft lot
$1,350,300 Zestimate®
$466/sqft
$108/mo HOA
What's special
- 73 days |
- 135 |
- 3 |
Zillow last checked:
Listed by:
Melinda Collins,
NextHome Axis Realty
Source: NextHome,MLS#: ML82039715
Tour with a local agent
Facts & features
Interior
Bedrooms & bathrooms
- Bedrooms: 8
- Bathrooms: 4
- Full bathrooms: 4
Features
- Has basement: No
Interior area
- Total structure area: 3,328
- Total interior livable area: 3,328 sqft
Property
Lot
- Size: 10,018 Square Feet
Details
- Parcel number: 49727004
Construction
Type & style
- Home type: MultiFamily
- Property subtype: Multi Family
Condition
- Year built: 1962
Community & HOA
HOA
- Has HOA: Yes
- Services included: HOA
- HOA fee: $108 monthly
Location
- Region: San Jose
Financial & listing details
- Price per square foot: $466/sqft
- Tax assessed value: $668,715
- Annual tax amount: $10,892
- Date on market: 3/20/2026
- Lease term: Contact For Details
Estimated market value
$1,350,300
$1.26M - $1.46M
$2,289/mo
Price history
| Date | Event | Price |
|---|---|---|
| 5/19/2026 | Pending sale | $1,550,000+17%$466/sqft |
Source: | ||
| 5/15/2026 | Sold | $1,325,000-14.5%$398/sqft |
Source: | ||
| 4/14/2026 | Contingent | $1,550,000$466/sqft |
Source: | ||
| 4/7/2026 | Listed for sale | $1,550,000$466/sqft |
Source: | ||
| 3/29/2026 | Pending sale | $1,550,000$466/sqft |
Source: | ||
| 3/29/2026 | Listed for sale | $1,550,000$466/sqft |
Source: | ||
| 3/27/2026 | Contingent | $1,550,000$466/sqft |
Source: | ||
| 3/21/2026 | Listed for sale | $1,550,000-8.2%$466/sqft |
Source: | ||
| 12/1/2025 | Listing removed | $1,688,000$507/sqft |
Source: | ||
| 10/24/2025 | Listed for sale | $1,688,000-5.2%$507/sqft |
Source: | ||
| 7/23/2025 | Listing removed | $1,780,000$535/sqft |
Source: | ||
| 1/25/2025 | Listed for sale | $1,780,000+3424.8%$535/sqft |
Source: | ||
| 6/20/2019 | Listing removed | $2,695$1/sqft |
Source: Go Section8 Report a problem | ||
| 5/8/2019 | Listed for rent | $2,695$1/sqft |
Source: Go Section8 Report a problem | ||
| 6/8/1999 | Sold | $50,500-82.3%$15/sqft |
Source: Public Record Report a problem | ||
| 2/16/1999 | Sold | $285,000$86/sqft |
Source: Public Record Report a problem | ||
Public tax history
| Year | Property taxes | Tax assessment |
|---|---|---|
| 2025 | $10,892 +3.8% | $668,715 +2% |
| 2024 | $10,498 +1.8% | $655,604 +2% |
| 2023 | $10,316 +1.9% | $642,750 +2% |
| 2022 | $10,122 +0.7% | $630,148 +2% |
| 2021 | $10,052 +2.3% | $617,795 +1% |
| 2020 | $9,825 | $611,461 +2% |
| 2019 | $9,825 +4% | $599,473 +2% |
| 2018 | $9,447 | $587,719 -15.2% |
| 2017 | $9,447 -13.1% | $693,093 +28.7% |
| 2016 | $10,867 +30.6% | $538,642 +1.5% |
| 2015 | $8,319 +3.3% | $530,552 +2% |
| 2014 | $8,057 | $520,160 +0.5% |
| 2013 | -- | $517,810 +3.6% |
| 2012 | -- | $500,000 +0.5% |
| 2011 | -- | $497,714 +0.8% |
| 2010 | -- | $493,995 -0.2% |
| 2009 | -- | $495,170 +2% |
| 2008 | -- | $485,462 +2% |
| 2007 | -- | $475,944 +2% |
| 2006 | -- | $466,613 +2% |
| 2005 | -- | $457,465 +2% |
| 2004 | -- | $448,496 +1.9% |
| 2003 | -- | $440,277 +2% |
| 2002 | -- | $431,645 +2% |
| 2001 | -- | $423,182 |
Find assessor info on the county website
Monthly payment
Est. payment$--/mo
Payment breakdown
Explore the cost of this home by adjusting the details. Changes won't be saved.
All calculations are estimates and provided by Zillow, Inc. for informational purposes only. Actual amounts may vary.
HOA fees may include property taxes on listings classified as Co-Ops. Contact the listing agent and/or owner for fee details.
Mortgage interest rates are dependent on a number of factors, including credit score, down payment, and repayment length. Interest rate data provided by Zillow Group Marketplace, Inc. as of 1/1/1970 from various mortgage lenders with which we have lead or other similar arrangements; the Estimated Payment is an average of those rates.
See how much you could borrow to make a competitive offer.
Climate risks
Neighborhood: Fairgrounds
Nearby schools
GreatSchools rating
- 3/10Captain Jason M. Dahl Elementary SchoolGrades: K-6Distance: 0.5 mi
- 4/10Sylvandale Middle SchoolGrades: 7-8Distance: 1 mi
- 5/10Andrew P. Hill High SchoolGrades: 9-12Distance: 0.5 mi
A local agent can set up tours, give advice and negotiate with sellers.

Local buyer's agents are ready to help
Nearby cities
Nearby neighborhoods
Nearby zip codes
Other San Jose Topics
