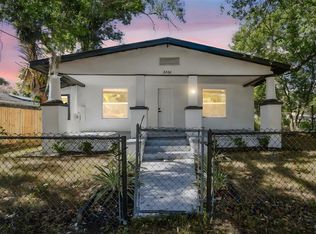
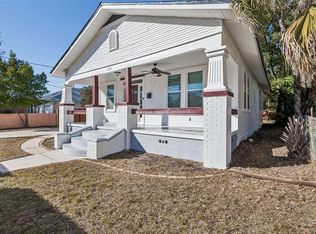
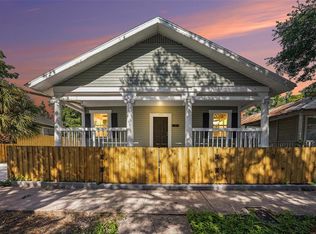
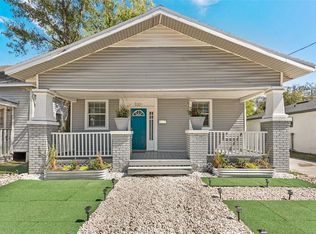
A Tampa gem! Endless Possibilities! This is a great investment property as a flip or rental or keep as a first time home! Quick This 1925 Bungalow features 3 bedrooms, 1 bathroom and and spacious layout! Come see today!
Pre-foreclosure
Est. $296,795
2905 E 21st Ave, Tampa, FL 33605
3beds
1,500sqft
Single Family Residence
Built in 1925
5,148 Square Feet Lot
$-- Zestimate®
$198/sqft
$-- HOA
Overview
- 300 days |
- 366 |
- 18 |
Originating MLS: Pinellas Suncoast
Facts & features
Interior
Bedrooms & bathrooms
- Bedrooms: 3
- Bathrooms: 1
- Full bathrooms: 1
Heating
- Forced air
Cooling
- Central
Appliances
- Included: Range / Oven, Refrigerator
Features
- Other
- Flooring: Carpet, Linoleum / Vinyl
Interior area
- Total interior livable area: 1,500 sqft
Property
Features
- Levels: One
- Exterior features: Other
Lot
- Size: 5,148 Square Feet
- Dimensions: 50X103
Details
- Parcel number: 1929084VU000001000070A
- Zoning: RM-16
Construction
Type & style
- Home type: SingleFamily
- Property subtype: Single Family Residence
Materials
- masonry
- Roof: Metal
Condition
- Year built: 1925
Utilities & green energy
- Sewer: Public Sewer
- Water: Public
- Utilities for property: Public
Community & HOA
Community
- Subdivision: GREENVILLE SUB 3
Location
- Region: Tampa
Financial & listing details
- Price per square foot: $198/sqft
- Tax assessed value: $296,795
- Annual tax amount: $5,006
- Listing terms: Cash
- Ownership: Fee Simple
Visit our professional directory to find a foreclosure specialist in your area that can help with your home search.
Find a foreclosure agentForeclosure details
Estimated market value
Not available
Estimated sales range
Not available
$2,438/mo
Price history
Price history
| Date | Event | Price |
|---|---|---|
| 3/13/2026 | Listing removed | $357,000$238/sqft |
Source: | ||
| 1/17/2026 | Price change | $357,000-7.3%$238/sqft |
Source: | ||
| 4/6/2025 | Price change | $385,000+11.6%$257/sqft |
Source: | ||
| 1/23/2025 | Price change | $344,900-1.4%$230/sqft |
Source: | ||
| 11/27/2024 | Listed for sale | $349,900+7%$233/sqft |
Source: | ||
| 3/10/2023 | Sold | $327,000-6.6%$218/sqft |
Source: Public Record Report a problem | ||
| 2/5/2023 | Pending sale | $350,000$233/sqft |
Source: | ||
| 1/30/2023 | Listed for sale | $350,000+180%$233/sqft |
Source: | ||
| 4/29/2021 | Sold | $125,000+4.3%$83/sqft |
Source: Public Record Report a problem | ||
| 3/11/2021 | Pending sale | $119,900+21.2%$80/sqft |
Source: Stellar MLS #T3292014 Report a problem | ||
| 3/12/2020 | Listing removed | $98,900$66/sqft |
Source: CHARLES RUTENBERG REALTY INC #T3205887 Report a problem | ||
| 11/26/2019 | Pending sale | $98,900$66/sqft |
Source: CHARLES RUTENBERG REALTY INC #T3205887 Report a problem | ||
| 11/22/2019 | Price change | $98,900-1%$66/sqft |
Source: CHARLES RUTENBERG REALTY INC #T3205887 Report a problem | ||
| 10/29/2019 | Pending sale | $99,900$67/sqft |
Source: CHARLES RUTENBERG REALTY INC #T3205887 Report a problem | ||
| 10/21/2019 | Listed for sale | $99,900+1347.8%$67/sqft |
Source: CHARLES RUTENBERG REALTY INC #T3205887 Report a problem | ||
| 12/12/2014 | Sold | $6,900$5/sqft |
Source: Public Record Report a problem | ||
Public tax history
Public tax history
| Year | Property taxes | Tax assessment |
|---|---|---|
| 2024 | $5,006 +77.2% | $296,795 +114.7% |
| 2023 | $2,826 +4% | $138,257 +4.9% |
| 2022 | $2,718 +71.1% | $131,844 +99.4% |
| 2021 | $1,588 +12.1% | $66,134 +10% |
| 2020 | $1,417 +11.7% | $60,122 +10% |
| 2019 | $1,269 | $54,656 -23.8% |
| 2018 | $1,269 -2% | $71,745 +37.7% |
| 2017 | $1,295 +16.8% | $52,088 +26.8% |
| 2016 | $1,109 +13.5% | $41,064 +10% |
| 2015 | $977 +34% | $37,331 +14.3% |
| 2014 | $729 | $32,656 +10% |
| 2013 | $729 +17.2% | $29,687 +9.1% |
| 2012 | $622 -14.5% | $27,219 -15.1% |
| 2011 | $728 -13.5% | $32,069 -14.7% |
| 2010 | $842 -57.2% | $37,576 -58.1% |
| 2009 | $1,969 -23% | $89,588 -22.9% |
| 2008 | $2,556 +0.1% | $116,249 -1% |
| 2007 | $2,552 +1.3% | $117,471 +10.9% |
| 2006 | $2,518 +28% | $105,922 +32.4% |
| 2005 | $1,968 | $80,023 +32.3% |
| 2004 | -- | $60,493 +10.1% |
| 2003 | -- | $54,948 +1.7% |
| 2002 | -- | $54,041 +11.7% |
| 2001 | -- | $48,401 +17.6% |
| 2000 | $1,050 | $41,171 |
Find assessor info on the county website
BuyAbility℠ payment
Estimated monthly payment
Boost your down payment with 6% savings match
Earn up to a 6% match & get a competitive APY with a *. Zillow has partnered with to help get you home faster.
Learn more*Terms apply. Match provided by Foyer. Account offered by Pacific West Bank, Member FDIC.Climate risks
Neighborhood: Jackson Heights
Nearby schools
GreatSchools rating
- 2/10Washington Elementary SchoolGrades: PK-5Distance: 1.6 mi
- 5/10Madison Middle SchoolGrades: 6-8Distance: 7.2 mi
- 5/10Middleton High SchoolGrades: 9-12Distance: 1.4 mi