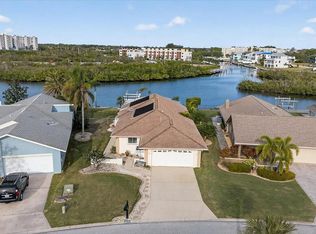
Residential Rental listed for 1600 in New Port Richey, FL
This property is off market, which means it's not currently listed for sale or rent on Zillow. This may be different from what's available on other websites or public sources.
$477,700
$411,000 - $545,000
$1,964/mo
List your home for rent
$1,964/mo
Rent Zestimate®
Find your next renter with Zillow Rental Manager. Plus, with online applications, you can quickly screen prospective tenants – for free.
Learn more$1,964/mo
Rent Zestimate®
Refinance and save
$3,269/mo
Est. payment
Refinancing to a lower rate could help reduce your monthly payments and save thousands over the life of the loan.
See today's rates$3,269/mo
Est. payment
Work with a Zillow partner agent
Leverage their expertise and Zillow's premium Showcase listings to get your home seen by more buyers.
Get startedList with your own agent
Get your home in front of millions of buyers by listing it on Zillow.
Learn how to do itSell it yourself
Take full control of how buyers see your home on Zillow by listing For Sale by Owner (FSBO).
List your homeResidential Rental listed for 1600 in New Port Richey, FL
This property is off market, which means it's not currently listed for sale or rent on Zillow. This may be different from what's available on other websites or public sources.
| Date | Event | Price |
|---|---|---|
| 10/7/2019 | Sold | $355,000+31.4%$206/sqft |
Source: Public Record Report a problem | ||
| 2/28/2017 | Listing removed | $1,600$1/sqft |
Source: Belloise Tropical Realty #U7799344 Report a problem | ||
| 2/18/2017 | Listed for rent | $1,600-3%$1/sqft |
Source: Belloise Tropical Realty #U7799344 Report a problem | ||
| 11/30/2016 | Listing removed | $1,650+3.1%$1/sqft |
Source: Belloise Tropical Realty #U7799344 Report a problem | ||
| 7/18/2013 | Listing removed | $1,600$1/sqft |
Source: Belloise Realty Tropical #U7582106 Report a problem | ||
| 6/1/2013 | Price change | $1,600-5.9%$1/sqft |
Source: Belloise Realty Tropical #U7582106 Report a problem | ||
| 5/16/2013 | Listed for rent | $1,700+6.3%$1/sqft |
Source: Belloise Realty Tropical #U7582106 Report a problem | ||
| 1/7/2013 | Listing removed | $1,600$1/sqft |
Source: Belloise Realty Tropical #U7566085 Report a problem | ||
| 12/4/2012 | Listed for rent | $1,600$1/sqft |
Source: Belloise Realty Tropical, Inc. #U7566085 Report a problem | ||
| 11/29/2012 | Sold | $270,200-8.4%$157/sqft |
Source: Public Record Report a problem | ||
| 10/4/2012 | Price change | $294,900-6.4%$171/sqft |
Source: RE/MAX REALTEC GROUP #U7557661 Report a problem | ||
| 9/1/2012 | Price change | $314,900+7.1%$183/sqft |
Source: RE/MAX REALTEC GROUP INC. #U7557661 Report a problem | ||
| 8/2/2012 | Listed for sale | -- |
Source: Homepath Report a problem | ||
| 7/17/2012 | Sold | $294,000-1.7%$171/sqft |
Source: Public Record Report a problem | ||
| 1/12/2012 | Listed for sale | $299,000-9.3%$174/sqft |
Source: CENTURY 21 Professional Realty #W7518937 Report a problem | ||
| 10/16/2011 | Listing removed | $329,500$191/sqft |
Source: CENTURY 21 Professional Realty #7465171 Report a problem | ||
| 5/29/2011 | Price change | $329,500-8.2%$191/sqft |
Source: Professional Realty #7465171 Report a problem | ||
| 4/21/2011 | Listed for sale | $359,000-12.4%$208/sqft |
Source: Professional Realty #7465171 Report a problem | ||
| 11/6/2010 | Listing removed | $409,900$238/sqft |
Source: CENTURY 21 Professional Realty #7465171 Report a problem | ||
| 5/29/2010 | Listed for sale | $409,900+38.9%$238/sqft |
Source: CENTURY 21 Professional Realty #7465171 Report a problem | ||
| 6/11/2003 | Sold | $295,000+28.3%$171/sqft |
Source: Public Record Report a problem | ||
| 6/19/2001 | Sold | $230,000$133/sqft |
Source: Public Record Report a problem | ||
| Year | Property taxes | Tax assessment |
|---|---|---|
| 2024 | $237 +3% | $384,450 |
| 2023 | $230 +3.1% | $384,450 +3% |
| 2022 | $223 +3.2% | $373,260 +6.1% |
| 2021 | $216 +3.3% | $351,840 +1.4% |
| 2020 | $209 -96.3% | $346,984 +3.9% |
| 2019 | $5,668 | $333,880 +2.7% |
| 2018 | $5,668 +8.1% | $325,041 +17.8% |
| 2017 | $5,244 +10.4% | $275,936 +4.4% |
| 2016 | $4,749 +4.5% | $264,309 +3% |
| 2015 | $4,543 +6.1% | $256,608 +4.3% |
| 2014 | $4,281 | $245,997 +2.7% |
| 2013 | -- | $239,570 +4.4% |
| 2012 | -- | $229,450 -1.7% |
| 2011 | -- | $233,410 -0.1% |
| 2010 | -- | $233,614 -22.1% |
| 2009 | -- | $299,943 -14.8% |
| 2008 | -- | $351,921 -5.2% |
| 2007 | -- | $371,127 +1.4% |
| 2006 | -- | $366,035 +12.9% |
| 2005 | -- | $324,184 +34.8% |
| 2004 | -- | $240,561 +8.6% |
| 2003 | -- | $221,592 +39.2% |
| 2002 | -- | $159,185 +17.6% |
| 2000 | -- | $135,385 |
| 1999 | -- | $135,385 |
Find assessor info on the county website
Source: The MLS. This data may not be complete. We recommend contacting the local school district to confirm school assignments for this home.