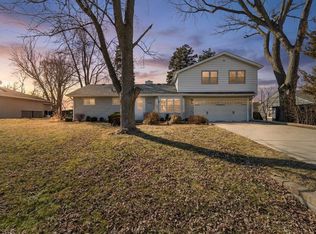
$1,650,000
4 bd|5 ba|5.2k sqft
5532 S Quincy St, Hinsdale, IL 60521
Sold

Zillow last checked:
Listing updated:
Diane Salach 630-327-2926,
@properties Christie's International Real Estate,
Kristine Oakey,
@properties Christie's International Real Estate
Not available
Estimated sales range
Not available
Not available
| Date | Event | Price |
|---|---|---|
| 5/16/2026 | Listed for sale | $599,000+64.1%$332/sqft |
Source: | ||
| 7/30/2021 | Sold | $365,000+15804.1%$202/sqft |
Source: | ||
| 7/2/2020 | Listing removed | $2,195$1/sqft |
Source: J.W. Reedy Realty #10733046 Report a problem | ||
| 6/2/2020 | Listed for rent | $2,195+12.6%$1/sqft |
Source: J.W. Reedy Realty #10733046 Report a problem | ||
| 5/11/2018 | Listing removed | $1,950$1/sqft |
Source: The AIM Realty Group, Inc. Report a problem | ||
| 4/22/2018 | Price change | $1,950-9.3%$1/sqft |
Source: Pan Realty #09889258 Report a problem | ||
| 3/29/2018 | Price change | $2,149-2.3%$1/sqft |
Source: Pan Realty #09889258 Report a problem | ||
| 9/12/2017 | Price change | $2,200-12%$1/sqft |
Source: Smothers Realty Group #09726088 Report a problem | ||
| 7/21/2017 | Listed for rent | $2,500+8.7%$1/sqft |
Source: Aim Realty Group #09726088 Report a problem | ||
| 6/6/2015 | Listing removed | $2,300$1/sqft |
Source: RE/MAX Suburban #08934969 Report a problem | ||
| 6/5/2015 | Sold | $2,295-4.4%$1/sqft |
Source: Agent Provided Report a problem | ||
| 5/29/2015 | Listed for rent | $2,300+15%$1/sqft |
Source: RE/MAX Suburban #08934969 Report a problem | ||
| 1/28/2015 | Listing removed | $2,000$1/sqft |
Source: RE/MAX Suburban #08815904 Report a problem | ||
| 1/15/2015 | Listed for rent | $2,000-16.7%$1/sqft |
Source: RE/MAX Suburban #08815904 Report a problem | ||
| 7/2/2014 | Sold | $2,400+4.6%$1/sqft |
Source: Agent Provided Report a problem | ||
| 7/1/2014 | Listing removed | $2,400$1/sqft |
Source: Real People Realty, Inc. #08604910 Report a problem | ||
| 5/12/2014 | Listed for rent | $2,400+9.3%$1/sqft |
Source: Real People Realty, Inc. #08604910 Report a problem | ||
| 6/17/2013 | Listing removed | $2,195$1/sqft |
Source: Real People Realty #08334317 Report a problem | ||
| 6/16/2013 | Sold | $2,295-99%$1/sqft |
Source: Agent Provided Report a problem | ||
| 6/11/2013 | Price change | $2,195-4.4%$1/sqft |
Source: Real People Realty #08334317 Report a problem | ||
| 5/6/2013 | Listed for rent | $2,295+6.7%$1/sqft |
Source: Real People Realty #08334317 Report a problem | ||
| 1/9/2013 | Listing removed | $2,150$1/sqft |
Source: Koenig & Strey Real Living #08154575 Report a problem | ||
| 10/27/2012 | Price change | $2,150-4.4%$1/sqft |
Source: Koenig & Strey Real Living #08154575 Report a problem | ||
| 9/9/2012 | Listed for rent | $2,250$1/sqft |
Source: Koenig & Strey Real Living #08154575 Report a problem | ||
| 7/6/2012 | Sold | $235,000-6%$130/sqft |
Source: | ||
| 6/9/2012 | Price change | $250,000-5.6%$139/sqft |
Source: ERA Jensen & Feinstein Realtors LLC #08027806 Report a problem | ||
| 5/19/2012 | Price change | $264,900-3.7%$147/sqft |
Source: ERA Team Feinstein LLC #08027806 Report a problem | ||
| 3/28/2012 | Listed for sale | $275,000$152/sqft |
Source: ERA Jensen & Feinstein Realtors LLC #08027806 Report a problem | ||
| Year | Property taxes | Tax assessment |
|---|---|---|
| 2024 | $7,138 +3.8% | $135,290 +8.8% |
| 2023 | $6,874 +2.9% | $124,370 +2.1% |
| 2022 | $6,678 +3.2% | $121,820 +1.2% |
| 2021 | $6,474 +1.8% | $120,430 +2% |
| 2020 | $6,361 +3.2% | $118,050 |
| 2019 | $6,165 +12.4% | -- |
| 2018 | $5,483 +10.2% | $101,440 +8.4% |
| 2017 | $4,974 +1.4% | $93,570 +4.8% |
| 2016 | $4,905 +0.7% | $89,300 +6.3% |
| 2015 | $4,869 +3.1% | $84,020 +3.9% |
| 2014 | $4,722 +2.6% | $80,860 +0.5% |
| 2013 | $4,601 +16.3% | $80,480 -4.3% |
| 2012 | $3,958 +4.1% | $84,100 -6.1% |
| 2011 | $3,803 -29.2% | $89,570 -32.9% |
| 2010 | $5,372 +2.4% | $133,420 -5.8% |
| 2009 | $5,246 +1.1% | $141,610 |
| 2008 | $5,190 +3.4% | $141,610 +5.9% |
| 2007 | $5,019 +6.6% | $133,720 +7% |
| 2006 | $4,706 +7.1% | $124,970 +7.7% |
| 2005 | $4,394 +17.9% | $116,030 +20% |
| 2004 | $3,727 +3.7% | $96,690 +10% |
| 2003 | $3,595 +29.8% | $87,900 +23% |
| 2002 | $2,770 -1.9% | $71,440 +6.8% |
| 2001 | $2,825 +15.3% | $66,910 +8.7% |
| 2000 | $2,449 | $61,560 |
Source: MRED as distributed by MLS GRID. This data may not be complete. We recommend contacting the local school district to confirm school assignments for this home.
A local agent can set up tours, give advice and negotiate with sellers.
A local lender can help you make sure your offer is ready when you are.