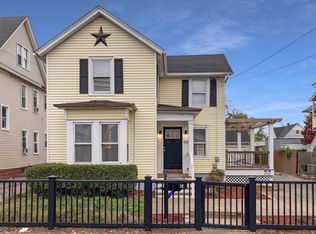
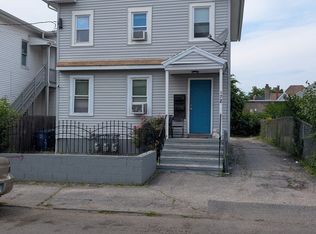
This spacious multifamily property offer 6 bedrooms, 3 bathrooms, and approximately 2,607sft of living space, with generous room sizes and multiple units, this property presents a great opportunity for both owner occupants and investor looking to ass a multifamily property to their property , conveniently located near local amenities , shopping , transportation and major routes. Don't miss the opportunity to make this Bridgeport multifamily yours.
For sale
$549,999
46 Deforest Avenue, Bridgeport, CT 06607
6beds
0baths
2,607sqft
Multi Family
Built in 1892
-- sqft lot
$548,900 Zestimate®
$211/sqft
$-- HOA
What's special
Generous room sizes
- 9 days
- 174
- 7
Zillow last checked:
Listing updated:
Listed by:
Ruiz-Esparza Team,
Jenny Munoz (203)241-8027,
Maple Vale Realty LLC 203-572-6180
Source: Smart MLS,MLS#: 24220628
Facts & features
Interior
Bedrooms & bathrooms
- Bedrooms: 6
- Bathrooms: 0
Heating
- Forced Air, Electric
Cooling
- Wall Unit(s)
Appliances
- Included: Electric Water Heater, Water Heater
Features
- Basement: Partial
- Attic: None
- Has fireplace: No
Interior area
- Total structure area: 2,607
- Total interior livable area: 2,607 sqft
- Finished area above ground: 2,607
Property
Lot
- Size: 4,791 Square Feet
Details
- Parcel number: 13286
- Zoning: C
Construction
Type & style
- Home type: MultiFamily
- Architectural style: Units on different Floors
- Property subtype: Multi Family
Materials
- Stucco
- Foundation: Stone
- Roof: Asphalt
Condition
- New construction: No
- Year built: 1892
Utilities & green energy
- Sewer: Public Sewer
- Water: Public
Community & HOA
HOA
- Has HOA: No
Location
- Region: Bridgeport
Financial & listing details
- Price per square foot: $211/sqft
- Tax assessed value: $138,100
- Annual tax amount: $6,000
- Date on market: 11/11/2026
Estimated market value
$548,900
$521,000 - $576,000
$2,636/mo
Price history
| Date | Event | Price |
|---|---|---|
| 11/11/2026 | Listed for sale | $549,999+0%$211/sqft |
Source:  Smart MLS #24220628 Report a problem | ||
| 11/7/2026 | Listing removed | $549,995$211/sqft |
Source: Smart MLS #24200843 Report a problem | ||
| 9/19/2026 | Price change | $549,995-8.3%$211/sqft |
Source: Smart MLS #24200843 Report a problem | ||
| 8/20/2026 | Listed for sale | $600,000+84.6%$230/sqft |
Source: Smart MLS #24200843 Report a problem | ||
| 6/17/2022 | Sold | $325,000-7.1%$125/sqft |
Source: Smart MLS #170466773 Report a problem | ||
| 4/11/2022 | Pending sale | $349,900$134/sqft |
Source:  RE/MAX International #170466773 Report a problem | ||
| 4/11/2022 | Contingent | $349,900$134/sqft |
Source: Smart MLS #170466773 Report a problem | ||
| 4/1/2022 | Listed for sale | $349,900$134/sqft |
Source: Smart MLS #170466773 Report a problem | ||
| 3/1/2022 | Contingent | $349,900$134/sqft |
Source: Smart MLS #170466773 Report a problem | ||
| 2/19/2022 | Pending sale | $349,900$134/sqft |
Source: RE/MAX International #170466773 Report a problem | ||
| 2/17/2022 | Listed for sale | $349,900+2815.8%$134/sqft |
Source: Smart MLS #170466773 Report a problem | ||
| 10/29/1998 | Sold | $12,000-58.6%$5/sqft |
Source: Smart MLS #98022341 Report a problem | ||
| 10/15/1996 | Sold | $29,000$11/sqft |
Source: Public Record Report a problem | ||
Public tax history
| Year | Property taxes | Tax assessment |
|---|---|---|
| 2025 | $6,000 | $138,100 |
| 2024 | $6,000 | $138,100 |
| 2023 | $6,000 | $138,100 |
| 2022 | $6,000 | $138,100 |
| 2021 | $6,000 +1.4% | $138,100 +26.1% |
| 2020 | $5,915 | $109,550 |
| 2019 | $5,915 -0.7% | $109,550 |
| 2018 | $5,956 | $109,550 |
| 2017 | $5,956 | $109,550 |
| 2016 | $5,956 -7.5% | $109,550 -28.2% |
| 2015 | $6,436 | $152,520 |
| 2014 | $6,436 +0.8% | $152,520 |
| 2013 | $6,383 +1.8% | $152,520 |
| 2012 | $6,270 +3.7% | $152,520 |
| 2011 | $6,046 | $152,520 |
| 2010 | $6,046 +2.3% | $152,520 |
| 2009 | $5,909 +36.7% | $152,520 +57.3% |
| 2008 | $4,323 +4% | $96,970 +0% |
| 2007 | $4,157 +1.4% | $96,950 |
| 2006 | $4,099 +8.4% | $96,950 |
| 2004 | $3,780 +24.8% | $96,950 +76.7% |
| 2003 | $3,029 -15.1% | $54,880 |
| 2001 | $3,567 +127.3% | $54,880 +127.4% |
| 2000 | $1,569 -0.3% | $24,136 -0.3% |
| 1999 | $1,573 | $24,200 |
Find assessor info on the county website
Monthly payment
Est. payment
Payment breakdown
Explore the cost of this home by adjusting the details. Changes won't be saved.Climate risks
Neighborhood: East End
Similar homes
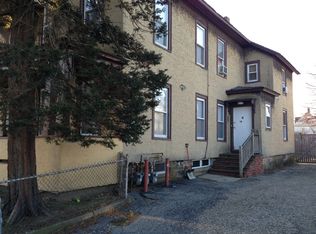
- $535,0006 bd3 ba2.3k sqft319 Carroll Avenue, Bridgeport, CT 06607For Sale

 MLS ID #24178746, Sara Barnaba, Century 21 Scala Group. Smart MLS
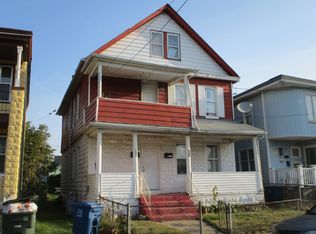
- $499,9008 bd3 ba2.3k sqft215-217 Deforest Avenue, Bridgeport, CT 06607For Sale
 MLS ID #24216454, Thomas Payne, Century 21 Scala Group. Smart MLS
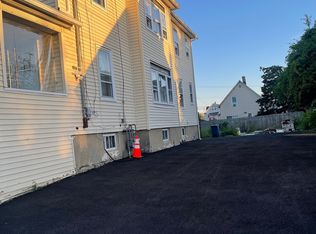
- $510,0004 bd2 ba2.9k sqft194 Adams Street, Bridgeport, CT 06607For Sale
 MLS ID #24207150, Olivia Barham, mygoodagent. Smart MLS
- $530,0007 bd2 ba2.3k sqft172 Hanover Street, Bridgeport, CT 06604For Sale
 MLS ID #24188321, Amiyra Beauduy, Century 21 Scala Group. Smart MLS
- $600,0006 bd3 ba3k sqft111 Calhoun Place, Bridgeport, CT 06604For SaleMLS ID #24222350, Komica Coote-Burwell, Coote & Burwell Realty,LLC. Smart MLS
- $599,9994 bd2 ba2.7k sqft202-204 Bunnell Street, Bridgeport, CT 06607For SaleMLS ID #24214894, Kimmy Vendryes-Martin, LPT Realty. Smart MLS
- $680,0008 bd3 ba3.2k sqft335 Wilmot Avenue, Bridgeport, CT 06607For SaleMLS ID #24221980, Komica Coote-Burwell, Coote & Burwell Realty,LLC. Smart MLS
- $475,0003 bd2 ba1.7k sqft72 Fifth Street, Bridgeport, CT 06607For SaleMLS ID #24222200, Jessica Torres, RE/MAX Heritage. Smart MLS
- $699,9008 bd3 ba3.4k sqft425-427 Wilmot Avenue, Bridgeport, CT 06607For SaleMLS ID #24221804, Rosania Melo, Rosana Melo Realty. Smart MLS
- $574,9005 bd3 ba1.8k sqft649 Maple Street, Bridgeport, CT 06608For SaleMLS ID #24220737, Charles W. Scott Jr, Tri-State Realty. Smart MLS
- $450,0006 bd2 ba2.8k sqft703-705 Connecticut Avenue, Bridgeport, CT 06607For SaleMLS ID #24196161, Jay Jones, RE/MAX Right Choice. Smart MLS
- $585,0005 bd2 ba2.2k sqft199 Park Street, Bridgeport, CT 06608For SaleMLS ID #24216209, Ana Isabel Naranjo, Keller Williams Prestige Prop.. Smart MLS
- $549,5006 bd3 ba2.9k sqft240 Sheridan Street, Bridgeport, CT 06610For SaleMLS ID #24210653, John Hackett, William Raveis Real Estate. Smart MLS
- $575,0005 bd3 ba2.5k sqft130 Horace Street, Bridgeport, CT 06610For SaleMLS ID #24217425, Heide Moeller, Coldwell Banker Realty. Smart MLS
- $480,0005 bd3 ba2k sqft446 Pond Street, Bridgeport, CT 06606For SaleMLS ID #24216867, Marcelle O. Sahossi, Keller Williams Prestige Prop.. Smart MLS
- $549,9995 bd2 ba1.6k sqft78 Fairmount Avenue, Bridgeport, CT 06606For SaleMLS ID #24140483, Marta Arroyo, William Raveis Real Estate. Smart MLS
- $580,0006 bd2 ba3.5k sqft695 Beechwood Avenue, Bridgeport, CT 06605For SaleMLS ID #24191854, Imelda O. Isles, eXp Realty. Smart MLS
- $579,9003 bd3 ba2.2k sqft249 Canaan Road, Stratford, CT 06614For SaleMLS ID #24219929, Stephen E. Wilhelm, Coldwell Banker Realty. Smart MLS
