Cozy corner 4 bedroom 1.5 bath home in Richmond Heights. This spacious home is waiting for you. Newly remodled house is furnished purchase as is, recent inspection report passed, storm widows
VA ASSUMABLE LOAN - WITH $30k DOWN 6.125%,BUYERS PAYS ANY CLOSING COST
For sale by owner
Street View
$355,000
2226 Fiesta Ct, Orlando, FL 32811
5beds
1,520sqft
SingleFamily
Built in 1970
8,107 Square Feet Lot
$-- Zestimate®
$234/sqft
$-- HOA
What's special
Spacious home
What the owner loves about this home
newly remodeled
- 10 days
- 473
- 11
Listed by:
Property Owner (916) 402-4874
Facts & features
Interior
Bedrooms & bathrooms
- Bedrooms: 5
- Bathrooms: 2
- Full bathrooms: 1
- 1/2 bathrooms: 1
Heating
- Forced air, Electric
Cooling
- Central
Appliances
- Included: Range / Oven, Refrigerator
Features
- Has fireplace: No
Interior area
- Total interior livable area: 1,520 sqft
Property
Lot
- Size: 8,107 Square Feet
Details
- Parcel number: 292305740800700
Construction
Type & style
- Home type: SingleFamily
Materials
- masonry
- Roof: Other
Condition
- New construction: No
- Year built: 1970
Community & HOA
Location
- Region: Orlando
Financial & listing details
- Price per square foot: $234/sqft
- Tax assessed value: $204,896
- Annual tax amount: $2,777
- Date on market: 11/8/2026
Estimated market value
Not available
Estimated sales range
Not available
$2,831/mo
Price history
| Date | Event | Price |
|---|---|---|
| 11/8/2026 | Listed for sale | $355,000+7.3%$234/sqft |
Source: Owner Report a problem | ||
| 10/30/2026 | Listing removed | $3,100$2/sqft |
Source: Zillow Rentals Report a problem | ||
| 9/24/2026 | Price change | $3,100+6.9%$2/sqft |
Source: Zillow Rentals Report a problem | ||
| 8/12/2026 | Price change | $2,900-9.4%$2/sqft |
Source: Zillow Rentals Report a problem | ||
| 6/15/2026 | Price change | $3,200-17.4%$2/sqft |
Source: Zillow Rentals Report a problem | ||
| 5/29/2026 | Listed for rent | $3,875+237%$3/sqft |
Source: Zillow Rentals Report a problem | ||
| 3/25/2026 | Sold | $331,000+4.1%$218/sqft |
Source:  Stellar MLS #O6364950 Report a problem | ||
| 2/4/2026 | Pending sale | $318,000$209/sqft |
Source: Stellar MLS #O6364950 Report a problem | ||
| 1/30/2026 | Price change | $318,000-0.3%$209/sqft |
Source: Stellar MLS #O6364950 Report a problem | ||
| 1/14/2026 | Listed for sale | $319,000$210/sqft |
Source: Stellar MLS #O6364950 Report a problem | ||
| 1/9/2026 | Pending sale | $319,000$210/sqft |
Source: Stellar MLS #O6364950 Report a problem | ||
| 1/5/2026 | Price change | $319,000-1.8%$210/sqft |
Source: Stellar MLS #O6364950 Report a problem | ||
| 12/4/2025 | Listed for sale | $325,000+80.6%$214/sqft |
Source: Stellar MLS #O6364950 Report a problem | ||
| 10/1/2025 | Sold | $180,000+0.1%$118/sqft |
Source: Stellar MLS #OM709392 Report a problem | ||
| 9/17/2025 | Pending sale | $179,800$118/sqft |
Source: Stellar MLS #OM709392 Report a problem | ||
| 9/11/2025 | Listed for sale | $179,800+33.2%$118/sqft |
Source: Stellar MLS #OM709392 Report a problem | ||
| 7/31/2019 | Listing removed | $1,150$1/sqft |
Source: Rent 1 Sale 1 Realty #219044794 Report a problem | ||
| 6/27/2019 | Listed for rent | $1,150+4.5%$1/sqft |
Source: Rent 1 Sale 1 Realty #219044794 Report a problem | ||
| 6/7/2017 | Listing removed | $1,100$1/sqft |
Source: Pacifica S.D. Management Report a problem | ||
| 5/8/2017 | Listed for rent | $1,100$1/sqft |
Source: Zillow Rental Manager Report a problem | ||
| 1/23/2017 | Listing removed | $1,100+29.4%$1/sqft |
Source: PSDM/SFR Report a problem | ||
| 5/29/2014 | Listing removed | $850$1/sqft |
Source: SFR 2012-1 Florida LLC Report a problem | ||
| 5/8/2014 | Listed for rent | $850$1/sqft |
Source: Pacifica S.D. Management Report a problem | ||
| 2/8/2013 | Listing removed | $850$1/sqft |
Source: Main Street Associates #O5138451 Report a problem | ||
| 1/16/2013 | Listed for rent | $850$1/sqft |
Source: Main Street Associates #O5138451 Report a problem | ||
| 2/24/2006 | Sold | $135,000+203.4%$89/sqft |
Source: Public Record Report a problem | ||
| 2/28/2001 | Sold | $44,500$29/sqft |
Source: Public Record Report a problem | ||
Public tax history
| Year | Property taxes | Tax assessment |
|---|---|---|
| 2024 | $2,777 +10.9% | $108,156 +10% |
| 2023 | $2,504 +15.7% | $98,324 +10% |
| 2022 | $2,165 +16.3% | $89,385 +10% |
| 2021 | $1,862 +6.2% | $81,259 +10% |
| 2020 | $1,753 +2.3% | $73,872 +10% |
| 2019 | $1,714 +8.1% | $67,156 +10% |
| 2018 | $1,585 +0% | $61,051 -16.9% |
| 2017 | $1,585 +19.9% | $73,496 +42.3% |
| 2016 | $1,322 +18.2% | $51,654 -5.6% |
| 2015 | $1,119 +10% | $54,729 +15.2% |
| 2014 | $1,017 +19.7% | $47,524 +25.4% |
| 2013 | $849 +16.8% | $37,907 +21% |
| 2012 | $727 -2.7% | $31,338 -2.8% |
| 2011 | $747 -14.7% | $32,243 -19% |
| 2010 | $875 | $39,790 -44.6% |
| 2009 | -- | $71,881 -23.8% |
| 2008 | $1,841 -4% | $94,354 -8.8% |
| 2007 | $1,917 +2.4% | $103,416 +11.7% |
| 2006 | $1,872 +17.5% | $92,555 +22.3% |
| 2005 | $1,593 +11.1% | $75,665 +9.3% |
| 2004 | $1,435 +5.5% | $69,234 +6.4% |
| 2003 | $1,359 +4.4% | $65,064 +4.5% |
| 2002 | $1,303 +79.5% | $62,237 +6.6% |
| 2001 | $726 +2.6% | $58,410 +5% |
| 2000 | $707 | $55,619 |
Find assessor info on the county website
Monthly payment
Est. payment
Payment breakdown
Explore the cost of this home by adjusting the details. Changes won't be saved.Climate risks
Neighborhood: Richmond Heights

Similar homes
- $355,0004 bd2 ba1.5k sqft3997 QUEEN ANNE DRIVE, ORLANDO, FL 32839For Sale
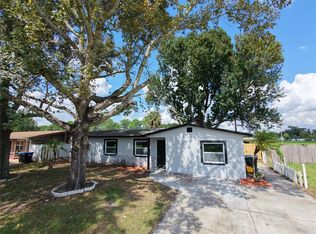
 MLS ID #O6450798, Jason Ni, REALTY HUB. Stellar MLS
- $294,4993 bd2 ba1.1k sqft1831 AARON AVENUE, ORLANDO, FL 32811For Sale
 MLS ID #S5155772, Jonatan Trillos, VESTI LLC. Stellar MLS
- $350,0004 bd2 ba1.8k sqft4904 DANNY BOY CIRCLE, ORLANDO, FL 32808For Sale
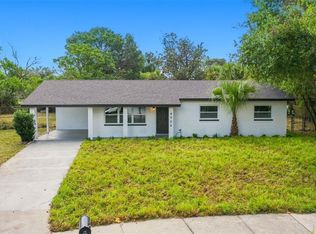 MLS ID #O6441388, Austin Cummings, NEXTDWELL. Stellar MLS
- $355,9004 bd2 ba1.6k sqft4058 LUAN DRIVE, ORLANDO, FL 32808For Sale
 MLS ID #O6445239, Ahmad Hassan, PA, COMPASS FLORIDA LLC. Stellar MLS
- $269,0003 bd2 ba950 sqft726 CORNELIA COURT, ORLANDO, FL 32811For SaleMLS ID #O6436357, Wendy Aldana LLC, PREFERRED REAL ESTATE BROKERS. Stellar MLS
- $369,9003 bd2 ba1.3k sqft3733 SURREY DRIVE, ORLANDO, FL 32812For SaleMLS ID #O6431177, Tuan Trinh, NATIONAL REAL ESTATE. Stellar MLS
- $309,0004 bd2 ba1.4k sqft4824 SHOSHONE STREET, ORLANDO, FL 32819For SaleMLS ID #O6416817, Guanhua Zhang, KN PREMIER REALTY, INC. Stellar MLS
- $348,0004 bd2 ba1.4k sqft430 SANTIAGO AVENUE, ORLANDO, FL 32807For SaleMLS ID #O6399783, Tony Hernandez, TRUVISION REAL ESTATE LLC. Stellar MLS
- $275,0004 bd2 ba1.2k sqft2410 SAVOY DRIVE, ORLANDO, FL 32808For SaleMLS ID #O6456495, Joseph Highsmith, Jr, RE/MAX PRIME PROPERTIES. Stellar MLS
- $359,9004 bd3 ba1.2k sqft606 EL VEDADO AVENUE, ORLANDO, FL 32807For SaleMLS ID #O6435622, Maite Gonzalez, LPT REALTY, LLC. Stellar MLS
- $325,0004 bd2 ba1k sqft4514 URBAN COURT, ORLANDO, FL 32810For SaleMLS ID #S5157376, Nadeem Ahmad, JUPITER PROPERTIES, INC. Stellar MLS
- $280,0004 bd2 ba1.2k sqft1612 28TH STREET, ORLANDO, FL 32805For SaleMLS ID #O6438154, Raquel Littlejohn, MAINSTAY BROKERAGE LLC. Stellar MLS
- $265,0003 bd2 ba1.1k sqft3942 WELLS STREET N, ORLANDO, FL 32805For SaleMLS ID #S5157295, Nadeem Ahmad, JUPITER PROPERTIES, INC. Stellar MLS
- $324,9004 bd2 ba1.4k sqft822 POLK STREET, ORLANDO, FL 32805For SaleMLS ID #O6391468, Darryl Henderson, Jr, GLOBAL ENTERPRISE REALTY GROUP. Stellar MLS
- $354,9003 bd3 ba1.5k sqft503 APRICOT DRIVE, OCOEE, FL 34761For SaleMLS ID #O6426274, Deon Paul, VYLLA HOME. Stellar MLS
- $349,9003 bd2 ba1.4k sqft8126 CASTINANGO STREET, ORLANDO, FL 32817For SaleMLS ID #O6447017, Jay LaCourt, ELLIS GROUP REALTY, LLC. Stellar MLS
- $359,0003 bd2 ba1.2k sqft3007 KNOLLWOOD CIRCLE, ORLANDO, FL 32804For SaleMLS ID #O6315760, Lindsey Hahn, ALL REAL ESTATE & INVESTMENTS. Stellar MLS
- $385,0004 bd3 ba1.6k sqft1519 INDIANA STREET, ORLANDO, FL 32805For SaleMLS ID #O6376779, Danny Mascarenhas, MASCARENHAS REALTY INC. Stellar MLS
- $469,9003 bd2 ba1.7k sqft1824 ROCK LAKE DRIVE, ORLANDO, FL 32805For SaleMLS ID #O6454870, Irene Calderon LLC, PREFERRED REAL ESTATE BROKERS. Stellar MLS
- $399,9004 bd3 ba1.8k sqft4823 KATHY JO TERRACE, ORLANDO, FL 32808For SaleMLS ID #O6372845, Yogi Ganeshram, EXP REALTY LLC. Stellar MLS
