Location, location, Location. This charming Bungalow is walking distance to everything. Park ave is a10 minute walk. Agave Azul, reel Fish and The Porch are all a stones throw away.
REALTORS DO NOT CONTACT ME UNLESS YOU HAVE A QUALIFIED BUYER.
This home has refurbished, hard wood floors, an outside entertainment center with a dining area and large shaded wood deck
In 2026 a new roof by Next Level, new plumbing by Emerald and foundation upgrade by Alpha. The HVAC is well maintained by English Air and purrs at 75 degrees.
Bungalow is a quiet cobblestone street with neighbours who are friendly but private.
This home can be sold furnished.
POF for showings only.
2nd home owner financing available.
I DO NOT NEED AN AGENT. Thank you
Buyers text owner directly at 787 667 5541
For sale by owner
$699,000
943 Bungalow Ave, Winter Park, FL 32789
3beds
1,313sqft
SingleFamily
Built in 1947
5,393 Square Feet Lot
$-- Zestimate®
$532/sqft
$-- HOA
What's special
Quiet cobblestone streetRefurbished hard wood floorsLarge shaded wood deck
What the owner loves about this home
The tranquility and location
- 46 days
- 1,325
- 121
Listed by:
Property Owner (787) 667-5541
Facts & features
Interior
Bedrooms & bathrooms
- Bedrooms: 3
- Bathrooms: 2
- Full bathrooms: 2
Heating
- Forced air
Cooling
- Other
Appliances
- Included: Dishwasher, Dryer, Freezer, Garbage disposal, Range / Oven, Refrigerator, Trash compactor, Washer
- Laundry: In Unit
Features
- Flooring: Carpet, Hardwood
- Basement: None
- Has fireplace: Yes
Interior area
- Total interior livable area: 1,313 sqft
Property
Parking
- Parking features: Off-street
Lot
- Size: 5,393 Square Feet
Details
- Parcel number: 292212104801080
Construction
Type & style
- Home type: SingleFamily
Materials
- masonry
- Roof: Composition
Condition
- New construction: No
- Year built: 1947
Community & HOA
Location
- Region: Winter Park
Financial & listing details
- Price per square foot: $532/sqft
- Tax assessed value: $432,071
- Annual tax amount: $6,832
- Date on market: 9/6/2026
Estimated market value
Not available
Estimated sales range
Not available
$2,976/mo
Price history
| Date | Event | Price |
|---|---|---|
| 9/6/2026 | Listed for sale | $699,000+33.1%$532/sqft |
Source: Owner Report a problem | ||
| 6/15/2023 | Sold | $525,000-4.4%$400/sqft |
Source: Public Record Report a problem | ||
| 4/20/2023 | Pending sale | $549,000$418/sqft |
Source:  Stellar MLS #S5077822 Report a problem | ||
| 3/18/2023 | Price change | $549,000-1.8%$418/sqft |
Source: Stellar MLS #S5077822 Report a problem | ||
| 3/14/2023 | Price change | $559,000-1.8%$426/sqft |
Source: Stellar MLS #S5077822 Report a problem | ||
| 3/4/2023 | Price change | $569,000-1.7%$433/sqft |
Source: Stellar MLS #S5077822 Report a problem | ||
| 1/20/2023 | Price change | $579,000-0.9%$441/sqft |
Source: Stellar MLS #S5077822 Report a problem | ||
| 12/4/2022 | Listed for sale | $584,000+37.4%$445/sqft |
Source: Stellar MLS #S5077822 Report a problem | ||
| 7/18/2022 | Sold | $425,000+3.7%$324/sqft |
Source: Public Record Report a problem | ||
| 7/8/2022 | Listed for sale | $410,000$312/sqft |
Source: Stellar MLS #O6014984 Report a problem | ||
| 4/9/2022 | Listing removed | -- |
Source: Stellar MLS #O6014984 Report a problem | ||
| 4/1/2022 | Pending sale | $410,000+59.1%$312/sqft |
Source: Stellar MLS #O6014984 Report a problem | ||
| 2/25/2021 | Listing removed | -- |
Source: Owner Report a problem | ||
| 2/13/2020 | Listing removed | $1,850$1/sqft |
Source: Owner Report a problem | ||
| 1/9/2020 | Listed for rent | $1,850$1/sqft |
Source: Owner Report a problem | ||
| 9/23/2018 | Listing removed | $1,850$1/sqft |
Source: Owner Report a problem | ||
| 9/10/2018 | Price change | $1,850-5.1%$1/sqft |
Source: Owner Report a problem | ||
| 8/9/2018 | Listed for rent | $1,950$1/sqft |
Source: Owner Report a problem | ||
| 12/30/2004 | Sold | $257,700+70.7%$196/sqft |
Source: Public Record Report a problem | ||
| 6/21/2001 | Sold | $151,000+39.8%$115/sqft |
Source: Public Record Report a problem | ||
| 9/4/1998 | Sold | $108,000$82/sqft |
Source: Public Record Report a problem | ||
Public tax history
| Year | Property taxes | Tax assessment |
|---|---|---|
| 2024 | $6,832 +21.6% | $432,071 +21.5% |
| 2023 | $5,620 +36.7% | $355,599 +34% |
| 2022 | $4,112 +8.1% | $265,302 +10% |
| 2021 | $3,804 +3.8% | $241,184 +9% |
| 2020 | $3,665 +11.6% | $221,330 +10% |
| 2019 | $3,283 -1% | $201,209 +0.5% |
| 2018 | $3,316 | $200,268 +10% |
| 2017 | $3,316 +117.1% | $182,015 +17.3% |
| 2016 | $1,527 +2.4% | $155,144 +3.6% |
| 2015 | $1,492 -2% | $149,823 +19.4% |
| 2014 | $1,523 +2.8% | $125,526 +2.4% |
| 2013 | $1,481 -0.3% | $122,587 +0.4% |
| 2012 | $1,486 -25% | $122,135 -18.5% |
| 2011 | $1,982 -8.6% | $149,774 -9.1% |
| 2010 | $2,169 | $164,804 -19.3% |
| 2009 | -- | $204,146 -13.9% |
| 2008 | $3,089 -3.2% | $237,042 +0% |
| 2007 | $3,191 -6.4% | $236,974 +0% |
| 2006 | $3,409 +0.1% | $236,932 +13.2% |
| 2005 | $3,406 +64.3% | $209,326 +24.1% |
| 2004 | $2,072 +5.9% | $168,680 +0.7% |
| 2003 | $1,958 +3% | $167,509 +26.2% |
| 2002 | $1,901 +102.2% | $132,753 +3.3% |
| 2001 | $940 +3.6% | $128,535 +27.6% |
| 2000 | $907 | $100,722 |
Find assessor info on the county website
Monthly payment
Est. payment
Payment breakdown
Explore the cost of this home by adjusting the details. Changes won't be saved.Climate risks
Neighborhood: 32789
- $604,6002 bd1 ba800 sqft950 Bungalow Ave, Winter Park, FL 32789Off Market

- $469,6002 bd1 ba891 sqft950 Bungalow Ave APT 2, Winter Park, FL 32789Off Market

- $469,6002 bd1 ba891 sqft950 Bungalow Ave APT 1, Winter Park, FL 32789Off Market
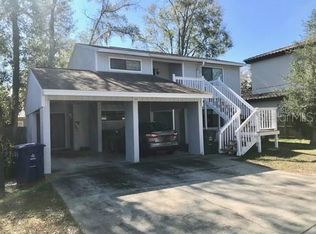
- $725,1003 bd3 ba1.8k sqft930 Bungalow Ave, Winter Park, FL 32789Off Market

Similar homes
- $699,9003 bd2 ba1.6k sqft1884 JESSICA COURT, WINTER PARK, FL 32789For Sale

 MLS ID #O6450978, Abby Nelson, RE/MAX 200 REALTY. Stellar MLS
- $699,0003 bd2 ba1.5k sqft1850 BRYAN AVENUE, WINTER PARK, FL 32789For Sale
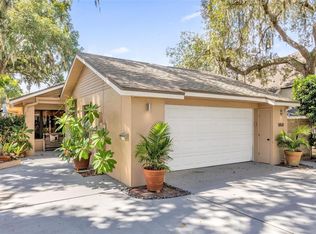 MLS ID #O6438184, Jennifer King, CORCORAN PREMIER REALTY. Stellar MLS
- $659,0003 bd3 ba1.7k sqft900 CARVER STREET, WINTER PARK, FL 32789For Sale
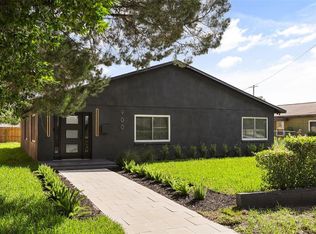 MLS ID #O6435435, Farhad Haniff, EXP REALTY LLC. Stellar MLS
- $695,0004 bd3 ba1.6k sqft2831 MULFORD AVENUE, WINTER PARK, FL 32789For Sale
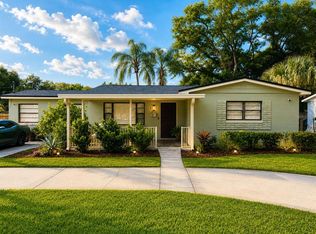 MLS ID #O6414319, Patrick Arenson, UNITED REAL ESTATE PREFERRED. Stellar MLS
- $620,0003 bd2 ba1.7k sqft624 DUNRAVEN DRIVE, WINTER PARK, FL 32792For SaleMLS ID #O6443159, Beth Logullo, KELLER WILLIAMS WINTER PARK. Stellar MLS
- $625,0004 bd4 ba1.8k sqft1016 ARAGON AVENUE, WINTER PARK, FL 32789For SaleMLS ID #O6433576, Pam Stewart, PALMANO GROUP RE BROKERAGE LLC. Stellar MLS
- $650,0002 bd2 ba1.2k sqft901 HARMON AVENUE, WINTER PARK, FL 32789For SaleMLS ID #O6425358, Samuel Kingsford, STOCKWORTH REALTY GROUP. Stellar MLS
- $575,0003 bd2 ba1.8k sqft1399 ALOMA AVENUE, WINTER PARK, FL 32789For SaleMLS ID #O6449858, Nancy Bagby, FANNIE HILLMAN & ASSOCIATES. Stellar MLS
- $450,0004 bd3 ba1.8k sqft239 ORANGE TERRACE DRIVE, WINTER PARK, FL 32789For SaleMLS ID #O6445496, Chris Creegan, CREEGAN GROUP. Stellar MLS
- $745,0002 bd3 ba1.4k sqft408 HOLT AVENUE, WINTER PARK, FL 32789For SaleMLS ID #O6405857, Brian Opre, THE REAL ESTATE PRINCIPLE, INC. Stellar MLS
- $649,0003 bd2 ba1.4k sqft250 CAROLINA AVENUE #202, WINTER PARK, FL 32789For SaleMLS ID #O6442686, Kevin McClanahan, FANNIE HILLMAN & ASSOCIATES. Stellar MLS
- $524,9003 bd2 ba1.4k sqft1741 WESTCHESTER AVENUE, WINTER PARK, FL 32789For SaleMLS ID #O6399014, Mick Night, PREMIER SOTHEBY'S INTL. REALTY. Stellar MLS
- $479,9003 bd2 ba1.6k sqft1660 ORANGE AVENUE, WINTER PARK, FL 32789For SaleMLS ID #L4965340, Gaby Murillo, EXP REALTY LLC. Stellar MLS
- $799,0003 bd3 ba1.9k sqft1278 S PENNSYLVANIA AVENUE #13, WINTER PARK, FL 32789For SaleMLS ID #O6417455, Nancy Merriam, PREMIER SOTHEBY'S INTL. REALTY. Stellar MLS
- $950,0002 bd2 ba1.9k sqft1411 DEVON ROAD, WINTER PARK, FL 32789For SaleMLS ID #O6449441, Harif Hazera LLC, PREMIER SOTHEBY'S INTL. REALTY. Stellar MLS
- $549,9003 bd2 ba1.8k sqft1003 LAKE BELL DRIVE, WINTER PARK, FL 32789For SaleMLS ID #O6418278, Bryan Douglas, KELLER WILLIAMS REALTY AT THE PARKS. Stellar MLS
- $429,0003 bd2 ba1.4k sqft1652 BERKSHIRE AVENUE, WINTER PARK, FL 32789For SaleMLS ID #O6432617, Brian Teach, COLDWELL BANKER REALTY. Stellar MLS
- $667,0003 bd2 ba1.6k sqft3000 CHELSEA STREET, ORLANDO, FL 32803For SaleMLS ID #O6444027, Octavio Abreu, NORKIS & CO REALTY. Stellar MLS
- $675,0003 bd2 ba1.6k sqft1819 LAKE SUE DRIVE, ORLANDO, FL 32803For SaleMLS ID #TB8542102, Bettina Guild, RE/MAX ACTION FIRST OF FLORIDA. Stellar MLS
