$216,500
2 bd|1 ba|1.1k sqft
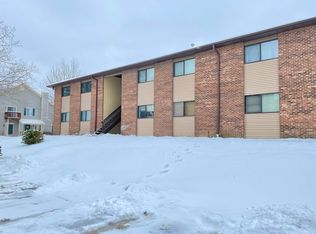
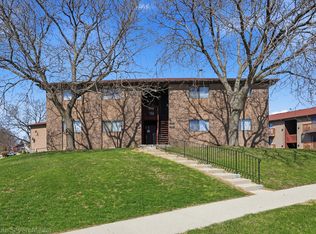
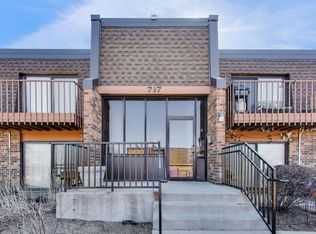
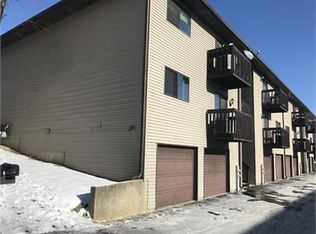
381 S Collins St APT A, South Elgin, IL 60177
Off Market
Zillow last checked:
Listing updated:
Grzegorz Milos 773-474-2616,
Century 21 Circle
Not available
Estimated sales range
Not available
Not available
| Date | Event | Price |
|---|---|---|
| 4/18/2026 | Listed for sale | $219,500+18191.7%$220/sqft |
Source: | ||
| 3/13/2019 | Listing removed | $1,250$1/sqft |
Source: Your Choice Real Estate Serv #10265170 Report a problem | ||
| 2/25/2019 | Price change | $1,250-3.8%$1/sqft |
Source: Your Choice Real Estate Serv #10265170 Report a problem | ||
| 2/7/2019 | Listed for rent | $1,300+8.3%$1/sqft |
Source: Your Choice Real Estate Serv #10265170 Report a problem | ||
| 6/1/2016 | Sold | $1,200+20%$1/sqft |
Source: Agent Provided Report a problem | ||
| 4/17/2016 | Listing removed | $1,200+4.3%$1/sqft |
Source: Your Choice Real Estate Serv #09175812 Report a problem | ||
| 9/26/2013 | Listing removed | $1,150$1/sqft |
Source: Your Choice Real Estate Serv #08420431 Report a problem | ||
| 9/19/2013 | Price change | $1,150-4.2%$1/sqft |
Source: Your Choice Real Estate Serv #08420431 Report a problem | ||
| 8/15/2013 | Listed for rent | $1,200+4.3%$1/sqft |
Source: Your Choice Real Estate Serv #08420431 Report a problem | ||
| 9/22/2012 | Listing removed | $1,150$1/sqft |
Source: Your Choice Real Estate Services #08158347 Report a problem | ||
| 9/14/2012 | Listed for rent | $1,150$1/sqft |
Source: Your Choice Real Estate Services #08158347 Report a problem | ||
| 12/15/2009 | Listing removed | $1,000$1/sqft |
Source: Preferred Homes Realty #07362126 Report a problem | ||
| 10/24/2009 | Listed for sale | $1,000-99.2%$1/sqft |
Source: Preferred Homes Realty #07362126 Report a problem | ||
| 9/10/2002 | Sold | $118,000$118/sqft |
Source: Public Record Report a problem | ||
| Year | Property taxes | Tax assessment |
|---|---|---|
| 2024 | $2,859 +6.6% | $44,232 +10.7% |
| 2023 | $2,681 +2.4% | $39,960 +9.7% |
| 2022 | $2,619 +7.2% | $36,437 +7% |
| 2021 | $2,444 +3.8% | $34,066 +4.8% |
| 2020 | $2,355 +4.6% | $32,521 +5% |
| 2019 | $2,251 +3% | $30,978 +6.1% |
| 2018 | $2,185 +6.3% | $29,184 +5.8% |
| 2017 | $2,056 -18.4% | $27,590 +7.8% |
| 2016 | $2,519 | $25,596 +9.1% |
| 2015 | -- | $23,461 +1.3% |
| 2014 | -- | $23,171 -10% |
| 2013 | -- | $25,748 -25.6% |
| 2012 | -- | $34,610 -10.7% |
| 2011 | -- | $38,744 +29.4% |
| 2010 | -- | $29,933 -34.9% |
| 2009 | -- | $45,971 |
| 2008 | -- | $45,971 +3.3% |
| 2007 | -- | $44,493 +4.2% |
| 2006 | -- | $42,704 +6.5% |
| 2005 | -- | $40,102 +6.8% |
| 2004 | -- | $37,563 +7.8% |
| 2003 | -- | $34,848 +8% |
| 2002 | -- | $32,266 +7.5% |
| 2001 | -- | $30,028 +5.1% |
| 2000 | -- | $28,577 |
Find assessor info on the county website
Source: MRED as distributed by MLS GRID. This data may not be complete. We recommend contacting the local school district to confirm school assignments for this home.
A local agent can set up tours, give advice and negotiate with sellers.
A local lender can help you make sure your offer is ready when you are.