Beautiful 3BR/2BA home with 2-car garage located in the gated community of Breakers West in the heart of West Palm Beach! This impeccably maintained neighborhood offers lush landscaping, peaceful nature preserves, Mature trees provide added beauty and privacy. Makes this the perfect place to call home!
For sale
Price cut: $25K (8/3)
$475,000
1100 Lytham Ct, West Palm Beach, FL 33411
3beds
1,682sqft
Single Family Residence, Residential
Built in 1993
6,098 Square Feet Lot
$459,300 Zestimate®
$282/sqft
$-- HOA
What's special
Peaceful nature preservesLush landscaping
- 30 days
- 1,137
- 80
Zillow last checked:
Listing updated:
Listed by:
DOUGLAS JEFFREY RILL 561-659-3630,
Century 21 America's Choice
Source: Palm Beach BOR,MLS#: 26-1239
Facts & features
Interior
Bedrooms & bathrooms
- Bedrooms: 3
- Bathrooms: 2
- Full bathrooms: 2
Primary bedroom
- Level: First
- Area: 280
- Dimensions: 20 x 14
Kitchen
- Level: First
- Area: 252
- Dimensions: 21 x 12
Living room
- Level: First
- Area: 280
- Dimensions: 20 x 14
Features
- Flooring: Hardwood
- Windows: Single Hung
Interior area
- Total structure area: 2,193
- Total interior livable area: 1,682 sqft
Property
Parking
- Parking features: Garage
- Has garage: Yes
Features
- Levels: One
- Pool features: None
- Waterfront features: None
Lot
- Size: 6,098 Square Feet
- Dimensions: 48 x 134
Details
- Parcel number: 00424330130000770
- Zoning: RS
Construction
Type & style
- Home type: SingleFamily
- Property subtype: Single Family Residence, Residential
Materials
- Block
- Roof: Asphalt
Condition
- Year built: 1993
Community & HOA
Community
- Security: Security Guard
- Subdivision: Breakers West
Location
- Region: West Palm Beach
Financial & listing details
- Price per square foot: $282/sqft
- Tax assessed value: $397,084
- Annual tax amount: $3,084
- Date on market: 9/24/2026
- Listing agreement: Exclusive Right To Sell
- Listing terms: Cash,Conventional
Estimated market value
$459,300
$436,000 - $482,000
$3,409/mo
Price history
| Date | Event | Price |
|---|---|---|
| 8/3/2026 | Price change | $475,000-5%$282/sqft |
Source:  BeachesMLS #B26004961 Report a problem | ||
| 3/20/2026 | Listed for sale | $500,000$297/sqft |
Source: BeachesMLS #B26004961 Report a problem | ||
| 3/16/2026 | Listing removed | $500,000$297/sqft |
Source: BeachesMLS #R11145468 Report a problem | ||
| 2/12/2026 | Listed for sale | $500,000$297/sqft |
Source: BeachesMLS #RX-11145468 Report a problem | ||
| 2/4/2026 | Listing removed | $500,000$297/sqft |
Source: BeachesMLS #RX-11145468 Report a problem | ||
| 1/7/2026 | Price change | $500,000-4.8%$297/sqft |
Source: BeachesMLS #RX-11145468 Report a problem | ||
| 12/5/2025 | Listed for sale | $525,000+262.1%$312/sqft |
Source: BeachesMLS #RX-11145468 Report a problem | ||
| 9/8/2000 | Sold | $145,000+20.8%$86/sqft |
Source: Public Record Report a problem | ||
| 5/18/2000 | Sold | $120,000-24.1%$71/sqft |
Source: Public Record Report a problem | ||
| 7/2/1993 | Sold | $158,000$94/sqft |
Source: Public Record Report a problem | ||
Public tax history
| Year | Property taxes | Tax assessment |
|---|---|---|
| 2025 | $3,084 +3.2% | $196,414 +2.9% |
| 2024 | $2,988 +3% | $190,879 +3% |
| 2023 | $2,901 +1.2% | $185,319 +3% |
| 2022 | $2,866 +1.8% | $179,921 +3% |
| 2021 | $2,816 +1.1% | $174,681 +1.4% |
| 2020 | $2,786 +1.3% | $172,269 +2.3% |
| 2019 | $2,750 | $168,396 +1.9% |
| 2018 | $2,750 +6.5% | $165,256 +2.1% |
| 2017 | $2,582 +2.6% | $161,857 +2.1% |
| 2016 | $2,517 +0.1% | $158,528 +0.7% |
| 2015 | $2,515 -2.2% | $157,426 +0.8% |
| 2014 | $2,572 +1.7% | $156,177 +1.5% |
| 2013 | $2,530 -1.7% | $153,869 -0.1% |
| 2012 | $2,573 +1.3% | $154,010 +3% |
| 2011 | $2,540 -11.3% | $149,524 -9.7% |
| 2010 | $2,865 +4.8% | $165,665 +0.4% |
| 2009 | $2,734 +11.6% | $165,012 +0.1% |
| 2008 | $2,450 -2.7% | $164,847 +3% |
| 2007 | $2,518 -6.4% | $160,046 +2.5% |
| 2006 | $2,689 | $156,142 +3% |
| 2005 | -- | $151,594 +3% |
| 2004 | $1,268 +486.8% | $147,179 +1.9% |
| 2003 | $216 -91.6% | $144,435 |
| 2002 | $2,557 +2% | $144,435 +2.9% |
| 2001 | $2,506 +21.1% | $140,342 +16.6% |
| 2000 | $2,069 +11.8% | $120,342 |
| 1999 | $1,851 | $120,342 |
Find assessor info on the county website
Monthly payment
Est. payment
Payment breakdown
Explore the cost of this home by adjusting the details. Changes won't be saved.Climate risks
Neighborhood: 33411


Similar homes
- $498,0003 bd2 ba1.9k sqft9663 Great Egret Court, West Palm Beach, FL 33411For Sale
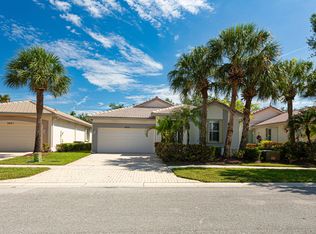
 MLS ID #B26041802, Britgid Rodriguez Bernal, Partnership Realty Inc.. BeachesMLS
- $575,0003 bd3 ba2.1k sqft9566 LANTERN BAY Circle, West Palm Beach, FL 33411For Sale
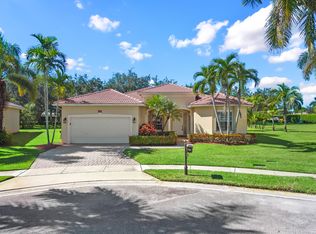 MLS ID #B26089009, Jordan Disney, Keller Williams Realty - Wellington. BeachesMLS
- $524,9004 bd2 ba1.5k sqft1240 Grandview Circle, Royal Palm Beach, FL 33411For Sale
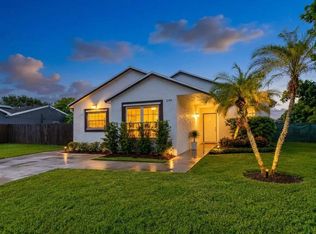 MLS ID #B26057887, Ryan L Jennings, Keller Williams Realty - Wellington. BeachesMLS
- $499,9993 bd2 ba1.7k sqft139 PRESERVE Drive, Royal Palm Beach, FL 33411For Sale
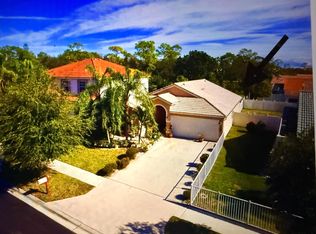 MLS ID #B26056854, Betty Khan, Remax Homes & Properties. BeachesMLS
- $470,0003 bd2 ba1.9k sqft873 Gazetta Way, West Palm Beach, FL 33413For SaleMLS ID #B26071291, Ming Huang, Atlantic Florida Properties In. BeachesMLS
- $599,0003 bd2 ba1.9k sqft9570 Lantern Bay Circle, West Palm Beach, FL 33411For SaleMLS ID #B26071680, Michael Whalen, Partnership Realty Inc.. BeachesMLS
- $519,0004 bd2 ba1.6k sqft120 Swan Parkway W, Royal Palm Beach, FL 33411For SaleMLS ID #B26043060, Evan Downing, Downing Street Realty. BeachesMLS
- $530,0003 bd2 ba1.5k sqft102 SAND PINE Way, Royal Palm Beach, FL 33411For SaleMLS ID #B26073758, Bryan Berns, FIRELIGHT REALTY GROUP LLC. BeachesMLS
- $389,0003 bd3 ba1.5k sqft2136 Tigris Drive, West Palm Beach, FL 33411For SaleMLS ID #B26077078, Charles A Campbell, Purple Cow Realty LLC. BeachesMLS
- $475,0002 bd2 ba1.8k sqft6605 JOG PALM Drive, Boynton Beach, FL 33437For SaleMLS ID #B26068845, Daniel Maxam, Samson Companies, LLC. BeachesMLS
- $524,9993 bd3 ba2.2k sqft2235 SOUNDINGS Court, Greenacres, FL 33413For SaleMLS ID #B26077655, Margarett Saavedra, United Realty Group Inc.. BeachesMLS
- $450,0003 bd2 ba1.5k sqft149 Cove Road, Greenacres, FL 33413For SaleMLS ID #B26050716, Shirlisa J Grehn, One Sotheby's International Realty. BeachesMLS
- $275,0002 bd2 ba1.4k sqft494 Iron Forge Court, Royal Palm Beach, FL 33411For SaleMLS ID #B26062399, Janice Street, Century 21 WC Realty. BeachesMLS
- $450,0003 bd2 ba1.3k sqft12280 Dartmoor Drive, Wellington, FL 33414For SaleMLS ID #B26041380, Steven B Jackson, RE/MAX Direct. BeachesMLS
- $465,0003 bd2 ba2.3k sqft7705 Mansfield Hollow Road, Delray Beach, FL 33446For SaleMLS ID #B26090629, Steven Koleno, Beycome of Florida LLC. BeachesMLS
- $459,000-- bd2 ba2k sqft4786 Sextant Circle, Boynton Beach, FL 33436For SaleMLS ID #B26091099, Bonnie N Rawitz, Luxury Partners Realty. BeachesMLS
- $575,0002 bd3 ba2.3k sqft8601 Via Grande E, Wellington, FL 33411For SaleMLS ID #R11156078, Julice Yorrick, United Realty Group Inc.. BeachesMLS
- $618,9004 bd3 ba2.1k sqft1534 Running Oak Lane, Royal Palm Beach, FL 33411For SaleMLS ID #B26058962, Talena Leon, Zulmax Realty Inc. BeachesMLS
- $380,0003 bd2 ba1.5k sqft5487 Crystal Anne Drive, West Palm Beach, FL 33417For SaleMLS ID #B26042067, Timothy E Lambert, LAER Realty Partners Bowen/Wellington. BeachesMLS
- $460,0003 bd3 ba1.7k sqft6803 Bitterbush Place, Boynton Beach, FL 33472For SaleMLS ID #B26023456, Lisa-Gaye Vernon, Baypointe Realty & Management. BeachesMLS
