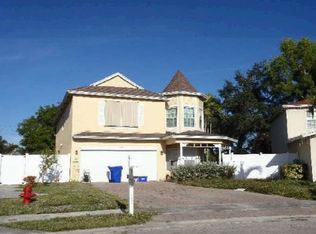
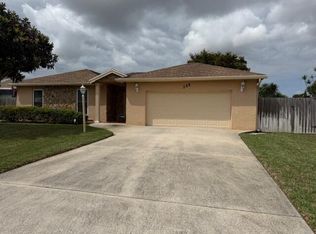
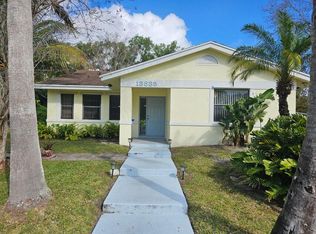
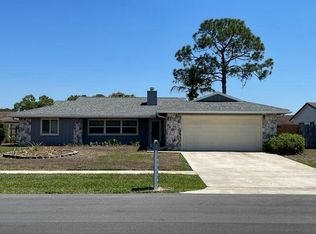
Great deal on this 3/2 2c split plan with a large family room, dining & living room, 2 walk in closets, new a/c compressor, oversized huge lot on a culde sac with a built in pool. Pool will be sparking blue in 1 week.Brokered And Advertised By: Swift Real Estate ServicesListing Agent: Debbie Swift
Pre-foreclosure
Est. $625,500
103 Oxford Ct, Royal Palm Beach, FL 33411
3beds
2baths
2,000sqft
SingleFamily
Built in 1990
0.4 Acres Lot
$625,500 Zestimate®
$313/sqft
$-- HOA
Overview
- 54 days |
- 698 |
- 66 |
Facts & features
Interior
Bedrooms & bathrooms
- Bedrooms: 3
- Bathrooms: 2
Heating
- Forced air
Cooling
- Central
Appliances
- Included: Dishwasher, Range / Oven, Refrigerator, Washer
Features
- Flooring: Tile
- Has fireplace: Yes
Interior area
- Total interior livable area: 2,000 sqft
Property
Parking
- Parking features: Garage
Features
- Exterior features: Stucco
Lot
- Size: 0.4 Acres
Details
- Parcel number: 72414327090010270
Construction
Type & style
- Home type: SingleFamily
Materials
- masonry
- Roof: Asphalt
Condition
- Year built: 1990
Community & HOA
Location
- Region: Royal Palm Beach
Financial & listing details
- Price per square foot: $313/sqft
- Tax assessed value: $462,926
- Annual tax amount: $194
Visit our professional directory to find a foreclosure specialist in your area that can help with your home search.
Find a foreclosure agentForeclosure details
Estimated market value
$625,500
$594,000 - $663,000
$4,037/mo
Price history
Price history
| Date | Event | Price |
|---|---|---|
| 6/29/2024 | Listing removed | $639,900$320/sqft |
Source: | ||
| 3/12/2024 | Pending sale | $639,900$320/sqft |
Source: | ||
| 3/8/2024 | Listed for sale | $639,900$320/sqft |
Source: | ||
| 2/14/2024 | Pending sale | $639,900$320/sqft |
Source: | ||
| 10/16/2023 | Listed for sale | $639,900+100%$320/sqft |
Source: | ||
| 5/18/2016 | Sold | $320,000+48.8%$160/sqft |
Source: | ||
| 2/22/2012 | Listing removed | $214,985$107/sqft |
Source: Swift Real Estate Services #R3243351 Report a problem | ||
| 2/1/2012 | Listed for sale | $214,985+48.7%$107/sqft |
Source: Swift Real Estate Services #R3243351 Report a problem | ||
| 2/1/2012 | Listing removed | $1,800$1/sqft |
Source: Illustrated Properteis Report a problem | ||
| 1/11/2012 | Listed for rent | $1,800$1/sqft |
Source: Illustrated Properteis Report a problem | ||
| 11/7/2011 | Sold | $144,600-63.1%$72/sqft |
Source: Public Record Report a problem | ||
| 8/9/2006 | Sold | $392,200+74.3%$196/sqft |
Source: Public Record Report a problem | ||
| 12/27/2002 | Sold | $225,000+47.1%$113/sqft |
Source: Public Record Report a problem | ||
| 7/23/1999 | Sold | $153,000$77/sqft |
Source: Public Record Report a problem | ||
Public tax history
Public tax history
| Year | Property taxes | Tax assessment |
|---|---|---|
| 2024 | $194 +3.2% | $297,810 +3% |
| 2023 | $188 +2.2% | $289,136 +3% |
| 2022 | $184 +3.4% | $280,715 +3% |
| 2021 | $178 +2.9% | $272,539 +1.4% |
| 2020 | $173 -1.1% | $268,776 +2.3% |
| 2019 | $175 | $262,733 +1.9% |
| 2018 | $175 | $257,834 +2.1% |
| 2017 | $175 +1.7% | $252,531 +8.6% |
| 2016 | $172 -96.5% | $232,602 +10% |
| 2015 | $4,888 +13.7% | $211,456 +10% |
| 2014 | $4,301 +13% | $192,233 +10% |
| 2013 | $3,806 -0.7% | $174,757 +0.6% |
| 2012 | $3,834 +11.3% | $173,739 +14.2% |
| 2011 | $3,446 -2.9% | $152,158 -2.4% |
| 2010 | $3,549 -0.6% | $155,964 -4.2% |
| 2009 | $3,572 -20.6% | $162,819 -29% |
| 2008 | $4,499 -13.1% | $229,355 -14.7% |
| 2007 | $5,178 +28.9% | $268,775 +24.7% |
| 2006 | $4,018 | $215,538 +3% |
| 2005 | -- | $209,260 +22% |
| 2004 | $2,202 +2017.5% | $171,586 +23.3% |
| 2003 | $104 -95.2% | $139,173 +21% |
| 2002 | $2,161 -12.8% | $114,978 -9.5% |
| 2001 | $2,477 +3.9% | $127,057 +2.9% |
| 2000 | $2,383 +11.2% | $123,503 0% |
| 1999 | $2,143 | $123,540 |
Find assessor info on the county website
Monthly payment
Estimated monthly payment
All calculations are estimates and provided by Zillow, Inc. for informational purposes only. Actual amounts may vary.
HOA fees may include property taxes on listings classified as Co-Ops. Contact the listing agent and/or owner for fee details.
Mortgage interest rates are dependent on a number of factors, including credit score, down payment, and repayment length. Interest rate data provided by Zillow Group Marketplace, Inc. as of 1/1/1970 from various mortgage lenders with which we have lead or other similar arrangements; the Estimated Payment is an average of those rates.
See how much you could borrow to make a competitive offer.
Climate risks
Neighborhood: 33411
Nearby schools
GreatSchools rating
- 8/10Cypress Trails Elementary SchoolGrades: PK-5Distance: 0.9 mi
- 8/10Crestwood Community Middle SchoolGrades: 6-8Distance: 0.6 mi
- 3/10Royal Palm Beach High SchoolGrades: 9-12Distance: 1.9 mi


- Florida
- Palm Beach County
- Royal Palm Beach
- 33411
- 103 Oxford Ct
Nearby cities
Nearby zip codes
Other Royal Palm Beach Topics
- Apartments for Rent in 33411
- Houses for Sale in 33411
- Houses for Rent in 33411
- 33411 Real Estate
- Royal Palm Beach Condos
- Houses for Sale in Royal Palm Beach
- Newest Listings in Royal Palm Beach
- Royal Palm Beach Home Values
- Royal Palm Beach Real Estate Agents
- Royal Palm Beach Refinance
- Royal Palm Beach Mortgage Rates
