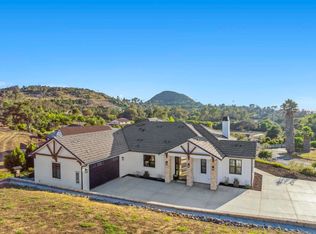
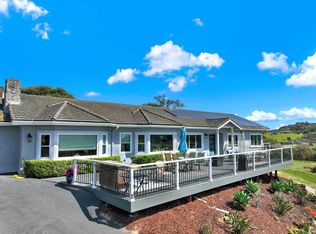
All updated by contractor. Views from every room ! Very usable land in a beautiful neighborhood..20 mins to the coast. Horse amenities in place . Zoned A70 with L designator. Cool ocean breezes everyday . Split level home .
For sale by owner
$2,000,000
4782 Sleeping Indian Rd, Fallbrook, CA 92028
3beds
2,800sqft
Est.: Get pre-qualified
SingleFamily
Built in 1969
13 Acres Lot
$-- Zestimate®
$714/sqft
$-- HOA
What's special
Hay barnAwesome panoramic viewsTack roomOak groveSuper soil
- 187 days |
- 634 |
- 28 |
Listed by:
Property Owner (760) 695-7029
Facts & features
Interior
Bedrooms & bathrooms
- Bedrooms: 3
- Bathrooms: 4
- Full bathrooms: 3
- 1/2 bathrooms: 1
Heating
- Forced air, Propane / Butane
Appliances
- Included: Dishwasher, Dryer, Freezer, Garbage disposal, Microwave, Range / Oven, Refrigerator, Washer
Features
- Flooring: Tile, Other, Carpet
- Has fireplace: Yes
Interior area
- Total interior livable area: 2,800 sqft
Property
Parking
- Total spaces: 10
- Parking features: Garage - Attached
Features
- Exterior features: Brick, Cement / Concrete
- Has view: Yes
- View description: Territorial, Mountain
Lot
- Size: 13 Acres
Details
- Parcel number: 1211304300
Construction
Type & style
- Home type: SingleFamily
Materials
- Roof: Asphalt
Condition
- New construction: No
- Year built: 1969
Community & HOA
Location
- Region: Fallbrook
Financial & listing details
- Price per square foot: $714/sqft
- Tax assessed value: $517,319
- Annual tax amount: $5,743
- Date on market: 11/28/2025
Estimated market value
Not available
Estimated sales range
Not available
$5,543/mo
Price history
| Date | Event | Price |
|---|---|---|
| 4/13/2026 | Listed for sale | $2,000,000$714/sqft |
Source: Owner Report a problem | ||
| 3/23/2026 | Listing removed | -- |
Source: Owner Report a problem | ||
| 11/28/2025 | Listed for sale | $2,000,000$714/sqft |
Source: Owner Report a problem | ||
| 11/1/2025 | Listing removed | $2,000,000+0%$714/sqft |
Source: | ||
| 5/14/2025 | Listed for sale | $1,999,5000%$714/sqft |
Source: | ||
| 1/5/2025 | Listing removed | -- |
Source: Owner Report a problem | ||
| 10/5/2024 | Listed for sale | $2,000,000$714/sqft |
Source: Owner Report a problem | ||
| 6/19/2024 | Listing removed | -- |
Source: | ||
| 3/26/2024 | Listed for sale | $2,000,000$714/sqft |
Source: | ||
| 10/6/2023 | Listing removed | -- |
Source: Owner Report a problem | ||
| 6/21/2023 | Price change | $2,000,000+0%$714/sqft |
Source: Owner Report a problem | ||
| 5/26/2023 | Listed for sale | $1,999,999+0%$714/sqft |
Source: Owner Report a problem | ||
| 4/28/2023 | Listing removed | -- |
Source: Owner Report a problem | ||
| 1/4/2023 | Listed for sale | $1,999,0000%$714/sqft |
Source: Owner Report a problem | ||
| 12/10/2022 | Listing removed | -- |
Source: | ||
| 8/24/2022 | Listed for sale | $1,999,9990%$714/sqft |
Source: | ||
| 5/1/2022 | Listing removed | -- |
Source: Owner Report a problem | ||
| 1/31/2022 | Listed for sale | $2,000,000$714/sqft |
Source: Owner Report a problem | ||
| 1/6/2022 | Listing removed | -- |
Source: Owner Report a problem | ||
| 10/8/2021 | Listed for sale | $2,000,000+42.9%$714/sqft |
Source: Owner Report a problem | ||
| 3/24/2021 | Listing removed | -- |
Source: Owner Report a problem | ||
| 7/3/2018 | Listing removed | $1,400,000+100%$500/sqft |
Source: Owner Report a problem | ||
| 9/24/2013 | Sold | $700,000+188.5%$250/sqft |
Source: Public Record Report a problem | ||
| 12/3/2010 | Sold | $242,595-67.7%$87/sqft |
Source: Public Record Report a problem | ||
| 7/15/2008 | Sold | $750,000$268/sqft |
Source: Public Record Report a problem | ||
Public tax history
| Year | Property taxes | Tax assessment |
|---|---|---|
| 2025 | $5,743 -0.7% | $517,319 +2% |
| 2024 | $5,782 +3.1% | $507,177 +2% |
| 2023 | $5,610 0% | $497,233 +2% |
| 2022 | $5,611 +3.3% | $487,484 +2% |
| 2021 | $5,434 -0.7% | $477,927 +1% |
| 2020 | $5,472 +10.8% | $473,028 +2% |
| 2019 | $4,937 -42.7% | $463,754 -38.5% |
| 2018 | $8,621 +1.9% | $754,154 +2% |
| 2017 | $8,460 +2.4% | $739,368 +2% |
| 2016 | $8,259 +1.5% | $724,872 +1.5% |
| 2015 | $8,134 +1.8% | $713,985 +2% |
| 2014 | $7,986 | $700,000 +54.4% |
| 2013 | -- | $453,288 +2% |
| 2012 | -- | $444,400 +1% |
| 2011 | -- | $440,000 -24.8% |
| 2010 | -- | $585,000 -19.9% |
| 2009 | -- | $730,000 +185.5% |
| 2008 | -- | $255,717 +2% |
| 2007 | -- | $250,704 +2% |
| 2006 | -- | $245,789 +2% |
| 2005 | -- | $240,971 +2% |
| 2004 | -- | $236,247 +1.9% |
| 2003 | -- | $231,918 +2% |
| 2002 | -- | $227,372 +2% |
| 2001 | -- | $222,914 |
Find assessor info on the county website
Monthly payment
Est. payment$--/mo
Payment breakdown
Explore the cost of this home by adjusting the details. Changes won't be saved.
All calculations are estimates and provided by Zillow, Inc. for informational purposes only. Actual amounts may vary.
HOA fees may include property taxes on listings classified as Co-Ops. Contact the listing agent and/or owner for fee details.
Mortgage interest rates are dependent on a number of factors, including credit score, down payment, and repayment length. Interest rate data provided by Zillow Group Marketplace, Inc. as of 1/1/1970 from various mortgage lenders with which we have lead or other similar arrangements; the Estimated Payment is an average of those rates.
See how much you could borrow to make a competitive offer.
Climate risks
Neighborhood: 92028
Getting around
4 / 100
Car-DependentNearby schools
GreatSchools rating
- 5/10Fallbrook Street Elementary SchoolGrades: K-6Distance: 5 mi
- 5/10James E. Potter Intermediate SchoolGrades: 7-8Distance: 4.8 mi
- 6/10Fallbrook High SchoolGrades: 9-12Distance: 3.2 mi
Schools provided by the listing agent
- District: FALLBROOKUNELEM,FALLBROOKUNH
Source: The MLS. This data may not be complete. We recommend contacting the local school district to confirm school assignments for this home.
A local agent can set up tours, give advice and negotiate with sellers.
Local buyer's agents are ready to help
- California
- San Diego County
- Fallbrook
- 92028
- 4782 Sleeping Indian Rd


