This 1324 square foot single family home has 3 bedrooms and 2.0 bathrooms. This home is located at 1173 SW Kickaboo Rd, Port Saint Lucie, FL 34953.
Pre-foreclosure
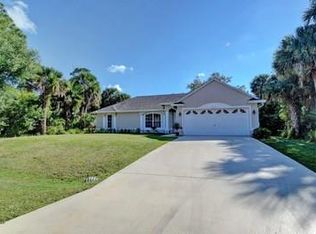
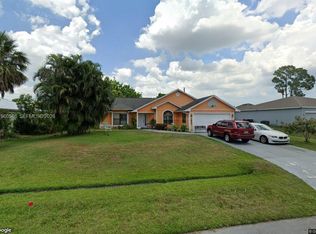
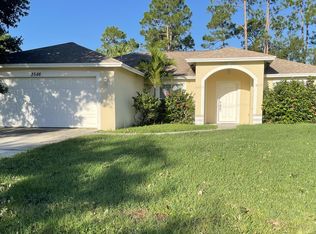
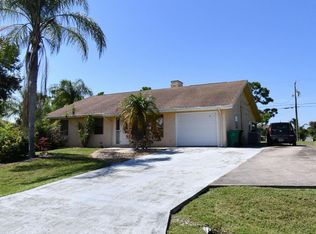
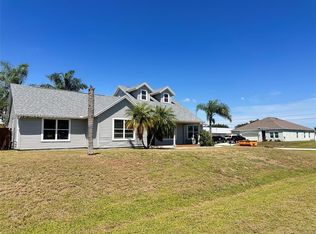
Street View
Est. $378,700
1173 SW Kickaboo Rd, Port Saint Lucie, FL 34953
3beds
2baths
1,324sqft
SingleFamily
Built in 1995
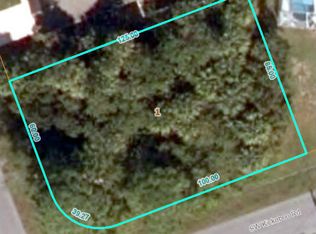
0.26 Acres Lot
$378,700 Zestimate®
$286/sqft
$-- HOA
Overview
- 72 days |
- 538 |
- 16 |
Facts & features
Interior
Bedrooms & bathrooms
- Bedrooms: 3
- Bathrooms: 2
Heating
- Forced air
Features
- Flooring: Tile, Carpet
Interior area
- Total interior livable area: 1,324 sqft
Property
Parking
- Parking features: Garage - Attached
Features
- Exterior features: Stucco, Cement / Concrete
Lot
- Size: 0.26 Acres
Details
- Parcel number: 342059016160001
Construction
Type & style
- Home type: SingleFamily
Materials
- Foundation: Concrete
- Roof: Metal
Condition
- Year built: 1995
Community & HOA
Location
- Region: Port Saint Lucie
Financial & listing details
- Price per square foot: $286/sqft
- Tax assessed value: $302,100
- Annual tax amount: $2,016
Visit our professional directory to find a foreclosure specialist in your area that can help with your home search.
Find a foreclosure agentForeclosure details
Estimated market value
$378,700
$352,000 - $401,000
$2,640/mo
Price history
Price history
Price history is unavailable.
Public tax history
Public tax history
| Year | Property taxes | Tax assessment |
|---|---|---|
| 2025 | $2,016 +4.1% | $104,411 +2.9% |
| 2024 | $1,937 +3.3% | $101,469 +3% |
| 2023 | $1,874 +6.5% | $98,514 +3% |
| 2022 | $1,759 +6.5% | $95,645 +3% |
| 2021 | $1,652 +0.3% | $92,860 +1.4% |
| 2020 | $1,647 | $91,578 +2.3% |
| 2019 | $1,647 +1.7% | $89,520 +1.9% |
| 2018 | $1,619 +6.3% | $87,851 -30.7% |
| 2017 | $1,523 +1.7% | $126,700 -4.2% |
| 2016 | $1,498 +2% | $132,300 +27.8% |
| 2015 | $1,468 -0.5% | $103,500 +24.7% |
| 2014 | $1,475 | $83,027 +1.5% |
| 2013 | -- | $81,800 +0.9% |
| 2012 | -- | $81,100 |
| 2011 | -- | $81,100 -3.5% |
| 2010 | -- | $84,000 -2.3% |
| 2009 | -- | $86,012 +0.1% |
| 2008 | -- | $85,926 +3% |
| 2007 | -- | $83,423 +34.6% |
| 2006 | -- | $61,974 +52.7% |
| 2005 | -- | $40,580 -30.5% |
| 2004 | -- | $58,416 |
| 2003 | -- | -- |
| 2002 | -- | -- |
| 2001 | -- | -- |
| 2000 | -- | -- |
Find assessor info on the county website
Monthly payment
Estimated monthly payment
All calculations are estimates and provided by Zillow, Inc. for informational purposes only. Actual amounts may vary.
HOA fees may include property taxes on listings classified as Co-Ops. Contact the listing agent and/or owner for fee details.
Mortgage interest rates are dependent on a number of factors, including credit score, down payment, and repayment length. Interest rate data provided by Zillow Group Marketplace, Inc. as of 1/1/1970 from various mortgage lenders with which we have lead or other similar arrangements; the Estimated Payment is an average of those rates.
See how much you could borrow to make a competitive offer.
Climate risks
Neighborhood: Rosser Reserve
Nearby schools
GreatSchools rating
- 4/10Floresta Elementary SchoolGrades: PK-5Distance: 5.8 mi
- 7/10Southport Middle SchoolGrades: 6-8Distance: 5.8 mi
- 5/10Treasure Coast High SchoolGrades: 9-12Distance: 1.6 mi


- Florida
- Saint Lucie County
- Port Saint Lucie
- 34953
- Rosser Reserve
- 1173 SW Kickaboo Rd
Nearby cities
Nearby neighborhoods
Nearby zip codes
Other Port Saint Lucie Topics
- Apartments for Rent in 34953
- Houses for Sale in 34953
- Houses for Rent in 34953
- 34953 Real Estate
- Port Saint Lucie Condos
- Houses for Sale in Port Saint Lucie
- Newest Listings in Port Saint Lucie
- Port Saint Lucie Home Values
- Port Saint Lucie Real Estate Agents
- Port Saint Lucie Refinance
- Port Saint Lucie Mortgage Rates
