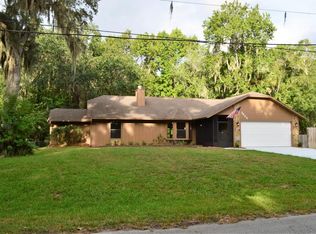
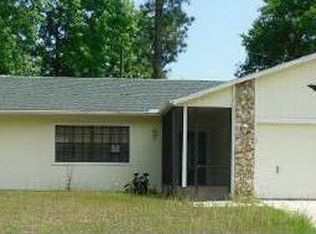
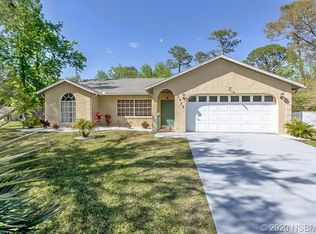
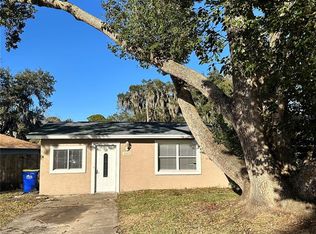
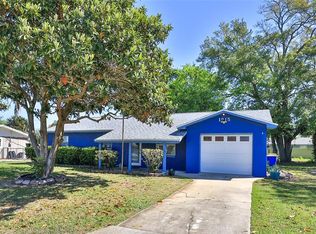
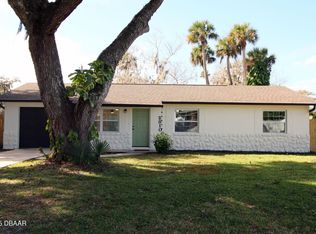
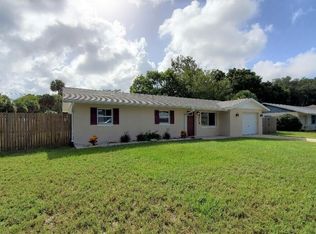
Great starter home in Florida Shores in Edgewater. This 3 bedroom 2 bathroom home was built 1986. Laminate flooring throughout most of the living areas. Large back yard, large enough for a pool! This is a Fannie Mae Homepath property.
Pre-foreclosure
Est. $234,581
3426 Silver Palm Dr, Edgewater, FL 32141
3beds
1,080sqft
Single Family Residence
Built in 1986
10,001 Square Feet Lot
$-- Zestimate®
$217/sqft
$-- HOA
Overview
- 67 days |
- 694 |
- 18 |
Originating MLS: West Volusia
Facts & features
Interior
Bedrooms & bathrooms
- Bedrooms: 3
- Bathrooms: 2
- Full bathrooms: 2
Heating
- Forced air, Electric
Cooling
- Central
Appliances
- Laundry: Inside
Features
- Ceiling Fans(s)
- Flooring: Tile, Laminate
Interior area
- Structure area source: Public Records
- Total interior livable area: 1,080 sqft
Property
Parking
- Parking features: Garage - Attached
Features
- Levels: One
- Exterior features: Wood
Lot
- Size: 10,001 Square Feet
- Features: Street Paved
- Residential vegetation: Trees/Landscaped
Details
- Parcel number: 840201154360
- Zoning: 07R-2B
- Special conditions: Real Estate Owned
Construction
Type & style
- Home type: SingleFamily
- Property subtype: Single Family Residence
Materials
- wood frame
- Foundation: Slab
- Roof: Asphalt
Condition
- Year built: 1986
Utilities & green energy
- Sewer: Septic Tank
- Water: Public
- Utilities for property: Electricity Connected
Community & HOA
Community
- Subdivision: FLORIDA SHORES 01
Location
- Region: Edgewater
Financial & listing details
- Price per square foot: $217/sqft
- Tax assessed value: $234,581
- Annual tax amount: $2,091
- Listing terms: Cash, Conventional, FHA, VA Loan
- Ownership: Fee Simple
Visit our professional directory to find a foreclosure specialist in your area that can help with your home search.
Find a foreclosure agentForeclosure details
Estimated market value
Not available
Estimated sales range
Not available
$1,976/mo
Price history
Price history
| Date | Event | Price |
|---|---|---|
| 3/10/2026 | Listing removed | $170,000$157/sqft |
Source: | ||
| 2/27/2026 | Listed for sale | $170,000-14.6%$157/sqft |
Source: | ||
| 9/9/2025 | Listing removed | $199,000$184/sqft |
Source: | ||
| 8/25/2025 | Pending sale | $199,000$184/sqft |
Source: | ||
| 8/20/2025 | Listed for sale | $199,000+32.3%$184/sqft |
Source: | ||
| 6/11/2020 | Sold | $150,400+3.8%$139/sqft |
Source: Public Record Report a problem | ||
| 4/9/2020 | Pending sale | $144,900$134/sqft |
Source: DISCOM REALTY INC #V4912046 Report a problem | ||
| 3/18/2020 | Price change | $144,900-5.9%$134/sqft |
Source: DISCOM REALTY INC #V4912046 Report a problem | ||
| 2/11/2020 | Listed for sale | $154,000+7.3%$143/sqft |
Source: DISCOM REALTY INC #V4912046 Report a problem | ||
| 2/8/2008 | Sold | $143,500+156.3%$133/sqft |
Source: Public Record Report a problem | ||
| 10/21/1999 | Sold | $56,000$52/sqft |
Source: Public Record Report a problem | ||
Public tax history
Public tax history
| Year | Property taxes | Tax assessment |
|---|---|---|
| 2024 | $2,091 +2.4% | $152,936 +3% |
| 2023 | $2,042 +2.8% | $148,482 +3% |
| 2022 | $1,986 | $144,157 +4.3% |
| 2021 | -- | $138,265 +115.9% |
| 2020 | $598 | $64,032 +2.3% |
| 2019 | $598 -1.8% | $62,592 +1.9% |
| 2018 | $608 -1% | $61,425 +2.1% |
| 2017 | $614 -2.2% | $60,162 +2.1% |
| 2016 | $628 -4.4% | $58,925 +0.7% |
| 2015 | $657 -3.1% | $58,515 +0.8% |
| 2014 | $678 | $58,051 +1.5% |
| 2013 | -- | $57,193 +1.7% |
| 2012 | -- | $56,237 +3% |
| 2011 | -- | $54,599 -17.9% |
| 2010 | -- | $66,474 -17.3% |
| 2009 | -- | $80,375 +32.3% |
| 2007 | -- | $60,763 -0.5% |
| 2006 | -- | $61,059 +6.1% |
| 2005 | -- | $57,554 +3% |
| 2004 | -- | $55,878 +1.9% |
| 2003 | -- | $54,836 +2.4% |
| 2002 | -- | $53,551 +1.6% |
| 2001 | -- | $52,708 +4.9% |
| 2000 | -- | $50,251 |
Find assessor info on the county website
Monthly payment
Estimated monthly payment
All calculations are estimates and provided by Zillow, Inc. for informational purposes only. Actual amounts may vary.
HOA fees may include property taxes on listings classified as Co-Ops. Contact the listing agent and/or owner for fee details.
Mortgage interest rates are dependent on a number of factors, including credit score, down payment, and repayment length. Interest rate data provided by Zillow Group Marketplace, Inc. as of 1/1/1970 from various mortgage lenders with which we have lead or other similar arrangements; the Estimated Payment is an average of those rates.
See how much you could borrow to make a competitive offer.
Climate risks
Neighborhood: 32141
Nearby schools
GreatSchools rating
- 7/10Indian River Elementary SchoolGrades: PK-5Distance: 1.4 mi
- 4/10New Smyrna Beach Middle SchoolGrades: 6-8Distance: 5 mi
- 4/10New Smyrna Beach High SchoolGrades: 9-12Distance: 5.2 mi


- Florida
- Volusia County
- Edgewater
- 32141
- 3426 Silver Palm Dr
Nearby cities
Nearby zip codes
Other Edgewater Topics
