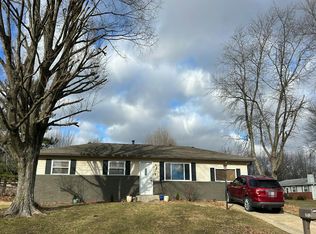
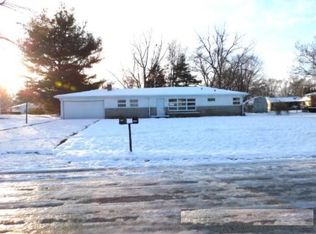
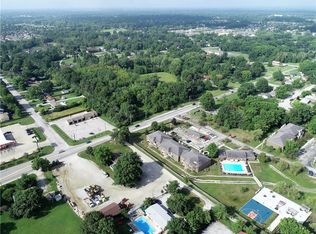
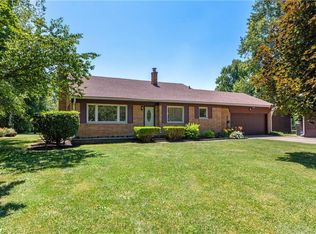
Amazing opportunity to make or save some money on this solid brick ranch home with a sprawling 2238 sq ft of living space on a 1.29 acre lot just West of Thompson/Emerson! Home is currently being lived in, but needs a full renovation. Renovated comparables are 325-350 K.
Pending
Price cut: $30.1K (2/16)
$199,900
4813 E Thompson Rd, Indianapolis, IN 46237
5beds
2,238sqft
Est.:
Residential, Single Family Residence
Built in 1968
1.29 Acres Lot
$-- Zestimate®
$89/sqft
$-- HOA
What's special
Solid brick ranch home
- 15 days |
- 866 |
- 75 |
Zillow last checked: 8 hours ago
Listing updated: February 18, 2026 at 02:15pm
Listing Provided by:
Avery Garrett 317-721-2274,
Streamlined Realty
Source: MIBOR as distributed by MLS GRID,MLS#: 22084162
Facts & features
Interior
Bedrooms & bathrooms
- Bedrooms: 5
- Bathrooms: 2
- Full bathrooms: 2
- Main level bathrooms: 2
- Main level bedrooms: 5
Primary bedroom
- Level: Main
- Area: 100 Square Feet
- Dimensions: 10x10
Bedroom 2
- Level: Main
- Area: 100 Square Feet
- Dimensions: 10x10
Bedroom 3
- Level: Main
- Area: 100 Square Feet
- Dimensions: 10x10
Bedroom 4
- Level: Main
- Area: 100 Square Feet
- Dimensions: 10x10
Bedroom 5
- Level: Main
- Area: 100 Square Feet
- Dimensions: 10x10
Dining room
- Level: Main
- Area: 100 Square Feet
- Dimensions: 10x10
Kitchen
- Features: Other
- Level: Main
- Area: 100 Square Feet
- Dimensions: 10x10
Living room
- Level: Main
- Area: 100 Square Feet
- Dimensions: 10x10
Heating
- Forced Air, Natural Gas
Cooling
- Central Air
Appliances
- Included: None
Features
- Hardwood Floors
- Flooring: Hardwood
- Has basement: No
- Number of fireplaces: 1
- Fireplace features: Dining Room
Interior area
- Total structure area: 2,238
- Total interior livable area: 2,238 sqft
Property
Parking
- Total spaces: 2
- Parking features: Attached
- Attached garage spaces: 2
Features
- Levels: One
- Stories: 1
Lot
- Size: 1.29 Acres
- Features: Mature Trees
Details
- Additional structures: Barn Mini
- Parcel number: 491504102026000500
- Special conditions: As Is,Fixer Upper
- Horse amenities: None
Construction
Type & style
- Home type: SingleFamily
- Architectural style: Ranch
- Property subtype: Residential, Single Family Residence
Materials
- Brick
- Foundation: Block
Condition
- Fixer
- New construction: No
- Year built: 1968
Utilities & green energy
- Water: Private
Community & HOA
Community
- Subdivision: No Subdivision
HOA
- Has HOA: No
Location
- Region: Indianapolis
Financial & listing details
- Price per square foot: $89/sqft
- Tax assessed value: $256,300
- Annual tax amount: $3,296
- Date on market: 2/16/2026
- Cumulative days on market: 16 days
Estimated market value
Not available
Estimated sales range
Not available
Not available
Price history
Price history
| Date | Event | Price |
|---|---|---|
| 2/17/2026 | Pending sale | $199,900$89/sqft |
Source: | ||
| 2/16/2026 | Price change | $199,900-13.1%$89/sqft |
Source: | ||
| 2/13/2026 | Pending sale | $230,000$103/sqft |
Source: Owner Report a problem | ||
| 1/30/2026 | Listed for sale | $230,000-17.9%$103/sqft |
Source: Owner Report a problem | ||
| 6/25/2024 | Listing removed | -- |
Source: Owner Report a problem | ||
| 6/15/2024 | Listed for sale | $280,000+3.7%$125/sqft |
Source: Owner Report a problem | ||
| 11/7/2023 | Listing removed | -- |
Source: Owner Report a problem | ||
| 10/28/2023 | Price change | $270,000+58.8%$121/sqft |
Source: Owner Report a problem | ||
| 10/27/2023 | Listed for sale | $170,000-40.4%$76/sqft |
Source: Owner Report a problem | ||
| 10/15/2023 | Listing removed | -- |
Source: Owner Report a problem | ||
| 10/12/2023 | Listed for sale | $285,000$127/sqft |
Source: Owner Report a problem | ||
Public tax history
Public tax history
| Year | Property taxes | Tax assessment |
|---|---|---|
| 2024 | $3,063 +5.8% | $256,300 +6.5% |
| 2023 | $2,895 +19.6% | $240,600 +8.2% |
| 2022 | $2,422 -45.3% | $222,400 +20.3% |
| 2021 | $4,427 +37.4% | $184,800 +9.2% |
| 2020 | $3,223 +1.3% | $169,200 +38.3% |
| 2019 | $3,183 +81.8% | $122,300 +0.2% |
| 2018 | $1,750 -3.2% | $122,000 +0.8% |
| 2017 | $1,808 +75.8% | $121,000 +3% |
| 2016 | $1,028 +48.2% | $117,500 -1.1% |
| 2014 | $694 -30.5% | $118,800 |
| 2013 | $998 | $118,800 +2.9% |
| 2012 | $998 | $115,400 +1% |
| 2011 | -- | $114,300 |
| 2010 | $840 +26.2% | $114,300 |
| 2009 | $666 | $114,300 -6.6% |
| 2007 | -- | $122,400 -0.1% |
| 2006 | -- | $122,500 |
| 2005 | -- | $122,500 |
| 2004 | -- | $122,500 -12.1% |
| 2003 | -- | $139,300 +97.3% |
| 2002 | -- | $70,600 +200% |
| 2001 | -- | $23,530 |
| 2000 | -- | $23,530 |
Find assessor info on the county website
BuyAbility℠ payment
Est. payment
$1,191/mo
Principal & interest
$1031
Property taxes
$160
Climate risks
Neighborhood: South Emerson
Nearby schools
GreatSchools rating
- 7/10Jeremiah Gray-Edison Elementary SchoolGrades: PK-5Distance: 0.4 mi
- 5/10Southport Middle SchoolGrades: 7-8Distance: 1.8 mi
- 4/10Southport High SchoolGrades: 9-12Distance: 3.3 mi
Schools provided by the listing agent
- Elementary: Jeremiah Gray Elementary School
- Middle: Southport Middle School
- High: Southport High School
Source: MIBOR as distributed by MLS GRID. This data may not be complete. We recommend contacting the local school district to confirm school assignments for this home.
Local experts in 46237