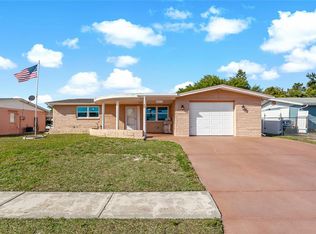
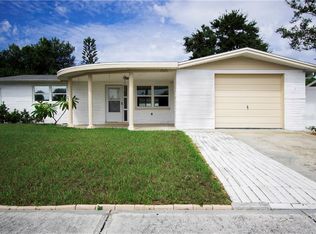
Why pay rent when you can own this charming home. Non-Flood Zone property. Perfect for First Time home buyers or as an investment opportunity. The neighborhood is friendly and welcoming Bedrooms are a comfortable size. Living room/dinning room combo with sliders leading out to Florida Room. Perfect for enjoying sunny afternoons. Extra shower and toilet locaated in garage. Great sized backyard with small shed. Located close to US 19 and downtown New Port Richey. Ceilings painted in 2018. Ac/c was serviced in 2017. Roof was replaced in 2012, new flooring in 2011 and fence replaced in 2008. Great value. Schedule your showing now.
Sold for $149,800
$149,800
4921 Durney St, New Port Richey, FL 34652
2beds
1,140sqft
SingleFamily
Built in 1972
6,098 Square Feet Lot
$210,400 Zestimate®
$131/sqft
$1,701 Estimated rent
Home value
$210,400
$191,000 - $229,000
$1,701/mo
Zestimate® history
Loading...
Owner options
List your home for rent
$1,701/mo
Rent Zestimate®
Find your next renter with Zillow Rental Manager. Plus, with online applications, you can quickly screen prospective tenants – for free.
Learn more$1,701/mo
Rent Zestimate®
Refinance and save
$1,051/mo
Est. payment
Refinancing to a lower rate could help reduce your monthly payments and save thousands over the life of the loan.
See today's rates$1,051/mo
Est. payment
Explore your selling options
Work with a Zillow partner agent
Leverage their expertise and Zillow's premium Showcase listings to get your home seen by more buyers.
Get startedList with your own agent
Get your home in front of millions of buyers by listing it on Zillow.
Learn how to do itSell it yourself
Take full control of how buyers see your home on Zillow by listing For Sale by Owner (FSBO).
List your homeWhat's special
Facts & features
Interior
Bedrooms & bathrooms
- Bedrooms: 2
- Bathrooms: 2
- Full bathrooms: 1
- 1/2 bathrooms: 1
Heating
- Forced air
Cooling
- Central
Appliances
- Included: Dryer, Microwave, Refrigerator, Washer
Features
- Smoke Alarm(S), Window Treatment, Blinds/Shades, Unfurnished
- Flooring: Carpet
Interior area
- Total interior livable area: 1,140 sqft
Property
Parking
- Parking features: Garage - Attached
Features
- Exterior features: Stucco
Lot
- Size: 6,098 sqft
Details
- Parcel number: 1726160630000001080
Construction
Type & style
- Home type: SingleFamily
- Architectural style: Traditional
Materials
- Concrete Block
- Roof: Asphalt
Condition
- Year built: 1972
Utilities & green energy
- Utilities for property: County Water, Street Lights, Public Utilities, Public Sewer, Public Municipal Water, Public Water Available
Community & neighborhood
Location
- Region: New Port Richey
Other
Other facts
- Appliances Included: Built In Oven
- Exterior Construction: Block
- Exterior Features: Sliding Doors, Utility Shed, Mature Landscaping, Fenced, Outdoor Lights, Gutters / Downspouts
- Financing Available: Cash, Conventional, FHA
- Foundation: Slab
- Garage Features: Washer/Dryer Hookup, Door Opener, Side Rear Entry
- Heatingand Fuel: Central
- Interior Features: Smoke Alarm(S), Window Treatment, Blinds/Shades, Unfurnished
- Listing Type: Exclusive Right to Sell
- Ownership: Fee Simple
- Property Type: Residential
- Roof: Shingle
- Status: Active
- Utilities: County Water, Street Lights, Public Utilities, Public Sewer, Public Municipal Water, Public Water Available
- Special Listing Type: Not Applicable
- Square Foot Source: Public Records
- Location: Close to Bus Line
- Property Style: Single Family Home
- Garage Carport: 1 Car Garage
- Property Description: One Story
- Additional Rooms: Florida Room
- Architectural Style: Traditional
- Interior Layout: Kitchen/Family Room Combo
- Last Change Type: New Listing
- Last Status: Incomplete
- Office Primary Board ID: Tampa
- Minimum Lease: No Minimum
- Ownership: Fee Simple
Price history
| Date | Event | Price |
|---|---|---|
| 3/30/2026 | Sold | $149,800+44.2%$131/sqft |
Source: Public Record Report a problem | ||
| 5/3/2018 | Sold | $103,900+6%$91/sqft |
Source: Public Record Report a problem | ||
| 2/25/2018 | Pending sale | $98,000$86/sqft |
Source: RE/MAX PREMIER GROUP #T2930379 Report a problem | ||
| 2/21/2018 | Listed for sale | $98,000+34.2%$86/sqft |
Source: RE/MAX PREMIER GROUP #T2930379 Report a problem | ||
| 9/12/2008 | Sold | $73,000+5.8%$64/sqft |
Source: Public Record Report a problem | ||
| 9/3/2008 | Listed for sale | $69,000-46.9%$61/sqft |
Source: Century 21 #7355321 Report a problem | ||
| 3/11/2008 | Listing removed | $129,900$114/sqft |
Source: Postlets #7295641 Report a problem | ||
| 1/1/2008 | Listed for sale | $129,900$114/sqft |
Source: Postlets #7295641 Report a problem | ||
Public tax history
| Year | Property taxes | Tax assessment |
|---|---|---|
| 2024 | $3,086 +8.4% | $203,678 +38.6% |
| 2023 | $2,846 +22.7% | $146,960 +10% |
| 2022 | $2,320 +16.4% | $133,600 +21% |
| 2021 | $1,992 +10% | $110,420 +10% |
| 2020 | $1,812 +8.2% | $100,390 +10% |
| 2019 | $1,674 | $91,266 +122.4% |
| 2018 | $1,674 +268.2% | $41,035 |
| 2017 | $455 +2% | $41,035 +4.2% |
| 2016 | $446 +12.8% | $39,364 +0.7% |
| 2015 | $395 +5.1% | $39,090 -8.2% |
| 2014 | $376 | $42,581 +11.4% |
| 2013 | -- | $38,207 +0.7% |
| 2012 | -- | $37,953 -23.3% |
| 2011 | -- | $49,455 -5.2% |
| 2010 | -- | $52,165 -19.5% |
| 2009 | -- | $64,781 -25% |
| 2008 | -- | $86,326 -13.7% |
| 2007 | -- | $100,048 +2% |
| 2006 | -- | $98,126 +35% |
| 2005 | -- | $72,698 +16.8% |
| 2004 | -- | $62,239 +12% |
| 2003 | -- | $55,589 +14.4% |
| 2002 | -- | $48,571 +22% |
| 2000 | -- | $39,801 |
| 1999 | -- | $39,801 |
Find assessor info on the county website
Neighborhood: Holiday Gardens Estates
Nearby schools
GreatSchools rating
- NAMittye P. Locke Elementary SchoolGrades: PK-5Distance: 0.9 mi
- 2/10Gulf Middle SchoolGrades: 6-8Distance: 1.1 mi
- 3/10Gulf High SchoolGrades: 9-12Distance: 0.3 mi
Get a cash offer in 3 minutes
Find out how much your home could sell for in as little as 3 minutes with a no-obligation cash offer.
Estimated market value
$210,400
Get a cash offer in 3 minutes
Find out how much your home could sell for in as little as 3 minutes with a no-obligation cash offer.
Estimated market value
$210,400