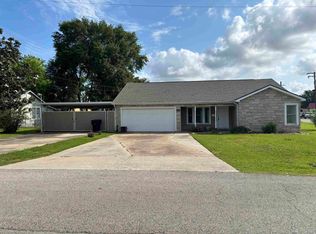
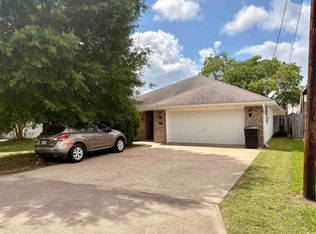
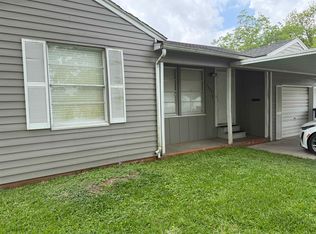
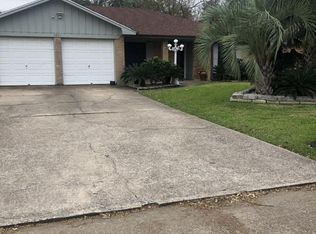
$200,900
3 bd|2 ba|1.5k sqft
8613 Lynwood Ln, Port Arthur, TX 77642
Off Market
Zillow last checked:
Listing updated:
Sarah Farid Datoo TREC #0823321 409-548-5006,
LPT Realty, LLC
Not available
Estimated sales range
Not available
$1,741/mo
| Date | Event | Price |
|---|---|---|
| 4/14/2026 | Price change | $239,000+4.4%$159/sqft |
Source: | ||
| 9/16/2025 | Price change | $229,000-4.6%$152/sqft |
Source: | ||
| 7/1/2025 | Price change | $240,000+9.1%$160/sqft |
Source: | ||
| 5/9/2025 | Pending sale | $219,900$146/sqft |
Source: | ||
| 10/25/2024 | Price change | $219,900-2.3%$146/sqft |
Source: | ||
| 10/22/2024 | Listed for sale | $225,000-7%$150/sqft |
Source: | ||
| 7/19/2024 | Listing removed | $242,000$161/sqft |
Source: | ||
| 5/2/2024 | Listed for sale | $242,000+62.4%$161/sqft |
Source: | ||
| 7/24/2020 | Sold | -- |
Source: Agent Provided Report a problem | ||
| 6/6/2020 | Price change | $149,000-9.7%$99/sqft |
Source: RE/MAX One - Beaumont #212206 Report a problem | ||
| 5/29/2020 | Price change | $165,000-2.4%$110/sqft |
Source: RE/MAX One - Beaumont #212206 Report a problem | ||
| 5/7/2020 | Listed for sale | $169,000-5.8%$113/sqft |
Source: Owner Report a problem | ||
| 2/3/2020 | Listing removed | $179,500$120/sqft |
Source: Owner Report a problem | ||
| 12/16/2019 | Listed for sale | $179,500+71%$120/sqft |
Source: Owner Report a problem | ||
| 10/10/2019 | Sold | -- |
Source: Public Record Report a problem | ||
| 9/6/2019 | Listed for sale | $105,000-8.3%$70/sqft |
Source: AMERICAN REAL ESTATE ERA POWERED 2 #78529 Report a problem | ||
| 1/11/2019 | Sold | -- |
Source: Public Record Report a problem | ||
| 3/23/2008 | Listing removed | $114,500$76/sqft |
Source: NCI Report a problem | ||
| 2/1/2008 | Listed for sale | $114,500$76/sqft |
Source: NCI Report a problem | ||
| Year | Property taxes | Tax assessment |
|---|---|---|
| 2025 | $4,638 +16.4% | $190,222 +20% |
| 2024 | $3,985 -3.6% | $158,518 -0.6% |
| 2023 | $4,134 -13.2% | $159,446 -7.4% |
| 2022 | $4,761 -1.1% | $172,219 +2.1% |
| 2021 | $4,813 +16.8% | $168,671 +14.6% |
| 2020 | $4,119 | $147,243 +10.5% |
| 2019 | $4,119 +12.3% | $133,280 +3.6% |
| 2018 | $3,669 +1.1% | $128,630 -1.9% |
| 2017 | $3,628 +75% | $131,090 +34.3% |
| 2016 | $2,073 -6.6% | $97,630 |
| 2015 | $2,220 | $97,630 |
| 2014 | $2,220 | $97,630 -6% |
| 2013 | -- | $103,820 +3.4% |
| 2012 | -- | $100,440 -8% |
| 2011 | -- | $109,130 |
| 2010 | -- | $109,130 -1.5% |
| 2009 | -- | $110,780 |
| 2008 | -- | $110,780 +7.3% |
| 2007 | -- | $103,200 +15.5% |
| 2006 | -- | $89,330 +1.9% |
| 2005 | -- | $87,680 +8.7% |
| 2004 | -- | $80,660 |
| 2003 | -- | $80,660 +10.8% |
| 2002 | -- | $72,790 -5.7% |
| 2001 | -- | $77,220 +8.5% |
| 2000 | -- | $71,150 |
Find assessor info on the county website
Source: HAR. This data may not be complete. We recommend contacting the local school district to confirm school assignments for this home.
A local agent can set up tours, give advice and negotiate with sellers.
A local lender can help you make sure your offer is ready when you are.