$275,000
3 bd|2 ba|2k sqft
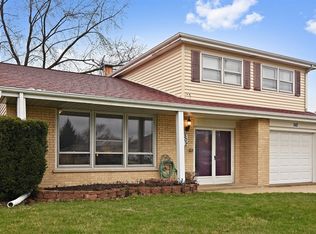
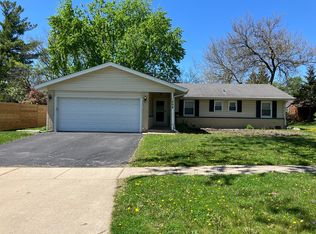
518 S Mount Prospect Rd, Des Plaines, IL 60016
Sold
Likely to sell faster than
Zillow last checked:
Listing updated:
Vanessa DeRussy (847)644-5587,
Real Broker LLC
$474,600
$451,000 - $498,000
$4,063/mo
| Date | Event | Price |
|---|---|---|
| 4/23/2026 | Price change | $480,000-3.1%$242/sqft |
Source: | ||
| 4/7/2026 | Listed for sale | $495,500+69.1%$250/sqft |
Source: | ||
| 3/9/2021 | Sold | $293,000-5.5%$148/sqft |
Source: | ||
| 2/10/2021 | Contingent | $309,900$157/sqft |
Source: | ||
| 1/27/2021 | Price change | $309,900-3.1%$157/sqft |
Source: | ||
| 12/20/2020 | Listed for sale | $319,900+23.5%$162/sqft |
Source: Northwest Suburban Real Estate #10956746 Report a problem | ||
| 7/6/2016 | Listing removed | $259,000$131/sqft |
Source: RE/MAX Unlimited Northwest #09094921 Report a problem | ||
| 6/29/2016 | Price change | $259,000-3.7%$131/sqft |
Source: RE/MAX Unlimited Northwest #09094921 Report a problem | ||
| 6/11/2016 | Price change | $269,000-1.8%$136/sqft |
Source: RE/MAX Unlimited Northwest #09094921 Report a problem | ||
| 5/21/2016 | Price change | $274,000-3.5%$138/sqft |
Source: RE/MAX Unlimited Northwest #09094921 Report a problem | ||
| 4/30/2016 | Price change | $284,000-1.7%$143/sqft |
Source: RE/MAX Unlimited Northwest #09094921 Report a problem | ||
| 2/10/2016 | Price change | $289,000-3.3%$146/sqft |
Source: RE/MAX Unlimited Northwest #09094921 Report a problem | ||
| 12/1/2015 | Price change | $299,000-0.3%$151/sqft |
Source: RE/MAX Unlimited Northwest #09094921 Report a problem | ||
| 10/5/2015 | Price change | $299,900-3.2%$151/sqft |
Source: Dream Town Realty #09026284 Report a problem | ||
| 6/25/2015 | Listed for sale | $309,900+10.7%$157/sqft |
Source: Century 21 Universal #08964409 Report a problem | ||
| 6/16/2003 | Sold | $280,000$141/sqft |
Source: Public Record Report a problem | ||
| Year | Property taxes | Tax assessment |
|---|---|---|
| 2023 | $7,775 -5.6% | $34,000 |
| 2022 | $8,237 -18.6% | $34,000 -6.7% |
| 2021 | $10,125 +2.2% | $36,441 |
| 2020 | $9,903 -1.1% | $36,441 -10% |
| 2019 | $10,010 +10.2% | $40,490 +24.5% |
| 2018 | $9,086 +25.3% | $32,510 |
| 2017 | $7,253 -6.4% | $32,510 |
| 2016 | $7,747 +8.6% | $32,510 +14% |
| 2015 | $7,133 +0.9% | $28,509 |
| 2014 | $7,068 +2.4% | $28,509 |
| 2013 | $6,902 +0.2% | $28,509 -9.4% |
| 2012 | $6,888 +2.7% | $31,459 |
| 2011 | $6,708 +0.5% | $31,459 |
| 2010 | $6,674 +2% | $31,459 -15.3% |
| 2009 | $6,545 +18.6% | $37,152 -7% |
| 2008 | $5,520 +9.5% | $39,949 |
| 2007 | $5,039 -4.1% | $39,949 +21% |
| 2006 | $5,255 -11.4% | $33,013 |
| 2005 | $5,928 +3.8% | $33,013 |
| 2004 | $5,711 +15.5% | $33,013 +19.1% |
| 2003 | $4,942 +13.8% | $27,714 |
| 2002 | $4,342 +13.7% | $27,714 |
| 2001 | $3,817 +1.8% | $27,714 +16.3% |
| 2000 | $3,750 +3% | $23,831 |
| 1999 | $3,641 | $23,831 |
Find assessor info on the county website
Source: MRED as distributed by MLS GRID. This data may not be complete. We recommend contacting the local school district to confirm school assignments for this home.
A local agent can set up tours, give advice and negotiate with sellers.