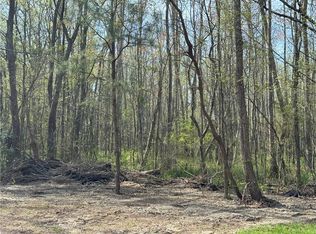
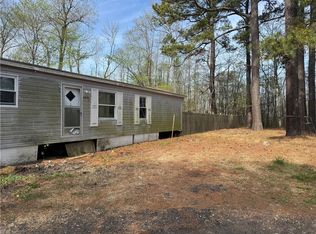
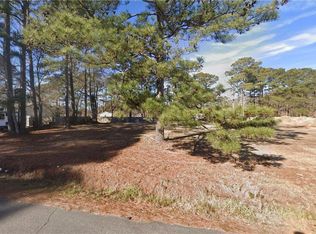
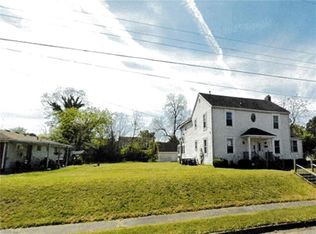
Prime commercial opportunity in a high-traffic location near Lynnhaven Mall! Zoned B-2, this versatile property offers endless potential for warehouse, office, retail, or mixed commercial use. Site plans available in the document section for added convenience. Excellent visibility and accessibility with close proximity to major roads, shopping, dining, and surrounding businesses. Priced to sell quickly—don’t miss this investment opportunity!
Lot/land
$125,000
513 S Lynnhaven Rd, Virginia Beach, VA 23452
--beds
--baths
0.83Acres
Unimproved Land
Built in ----
0.83 Acres Lot
$-- Zestimate®
$--/sqft
$-- HOA
What's special
High-traffic locationExcellent visibility and accessibility
- 26 days |
- 455 |
- 31 |
Zillow last checked:
Listing updated:
Listed by:
Nancy Barlow,
1st Class Real Estate Integrity 757-431-7521
Source: REIN Inc.,MLS#: 10634665
Facts & features
Property
Features
- Fencing: None
- On waterfront: Yes
- Waterfront features: Creek
Lot
- Size: 0.83 Acres
- Dimensions: 194 x 276 x 354
- Features: Cleared, .51 to 1.0 Acre
- Residential vegetation: Other
Details
- Additional structures: None
- Parcel number: 14961799430000
- Zoning: B2
Utilities & green energy
- Utilities for property: None
Community & HOA
Community
- Features: Sidewalks
- Subdivision: Lynnhaven - 160
Location
- Region: Virginia Beach
Financial & listing details
- Tax assessed value: $156,900
- Annual tax amount: $1,712
- Date on market: 5/13/2026
- Road surface type: Other
Estimated market value
Not available
Estimated sales range
Not available
$1,448/mo
Price history
Price history is unavailable.
Public tax history
| Year | Property taxes | Tax assessment |
|---|---|---|
| 2024 | $1,553 | $156,900 |
| 2023 | $1,553 | $156,900 |
| 2022 | $1,553 | $156,900 |
| 2021 | $1,553 -10.6% | $156,900 |
| 2020 | $1,738 +27.3% | $156,900 +15.2% |
| 2019 | $1,365 | $136,200 |
| 2018 | $1,365 0% | $136,200 |
| 2017 | $1,365 -35.4% | $136,200 |
| 2016 | $2,114 +6.5% | $136,200 +6.8% |
| 2015 | $1,984 | $127,500 |
| 2014 | $1,984 | $127,500 |
Find assessor info on the county website
Monthly payment
Estimated monthly payment$1,822
All calculations are estimates and provided by Zillow, Inc. for informational purposes only. Actual amounts may vary.
HOA fees may include property taxes on listings classified as Co-Ops. Contact the listing agent and/or owner for fee details.
Mortgage interest rates are dependent on a number of factors, including credit score, down payment, and repayment length. Interest rate data provided by Zillow Group Marketplace, Inc. as of 1/1/1970 from various mortgage lenders with which we have lead or other similar arrangements; the Estimated Payment is an average of those rates.
See how much you could borrow to make a competitive offer.
Climate risks
Neighborhood: 23452
Nearby schools
GreatSchools rating
- 5/10Brookwood Elementary SchoolGrades: PK-5Distance: 0.2 mi
- 8/10Plaza Middle SchoolGrades: 6-8Distance: 0.6 mi
- 5/10Green Run High SchoolGrades: PK,9-12Distance: 2.2 mi
Schools provided by the listing agent
- Elementary: Brookwood Elementary
- Middle: Plaza Middle
- High: Green Run
Source: REIN Inc.. This data may not be complete. We recommend contacting the local school district to confirm school assignments for this home.

A local agent can set up tours, give advice and negotiate with sellers.
A local lender can help you make sure your offer is ready when you are.
- Virginia
- Virginia Beach City
- Virginia Beach
- 23452
- 513 S Lynnhaven Rd
Nearby cities
Nearby neighborhoods
Nearby zip codes
Other Virginia Beach Topics
