Calling all investors! This two-story fire-damaged property offers 4 bedrooms, 2.5 bathrooms, approximately 1,802 square feet of living space, and plenty of potential for renovation. The home features a fireplace in the den, formal dining area, and an attached 2-car garage. Outside, you'll find a deck, patio, and wood-fenced backyard. Bring your vision and explore the possibilities this property has to offer. Schedule your showing today! One or more photos may have been virtually staged.
Pending
$49,900
5191 Orangewood Rd, Memphis, TN 38134
3beds
1,802sqft
Single Family Residence
Built in 1978
0.25 Acres Lot
$-- Zestimate®
$28/sqft
$-- HOA
What's special
Wood-fenced backyardFormal dining areaFireplace in the den
- 30 days
- 3,219
- 181
Likely to sell faster than
Zillow last checked:
Listing updated:
Listed by:
Michelle Woodland-Lidster,
Mainstay Brokerage, LLC 800-583-2914
Source: MAAR,MLS#: 10232100
Facts & features
Interior
Bedrooms & bathrooms
- Bedrooms: 3
- Bathrooms: 3
- Full bathrooms: 2
- 1/2 bathrooms: 1
Primary bedroom
- Width: 0
Dining room
- Width: 0
Living room
- Width: 0
Den
- Width: 0
Heating
- Other (See REMARKS)
Cooling
- Other (See REMARKS)
Features
- Other (See Remarks), Square Feet Source: AutoFill (MAARdata) or Public Records (Cnty Assessor Site)
- Number of fireplaces: 1
Interior area
- Total interior livable area: 1,802 sqft
Property
Parking
- Total spaces: 2
- Parking features: Driveway/Pad
- Covered spaces: 2
- Has uncovered spaces: Yes
Features
- Stories: 2
- Exterior features: Sidewalks
- Pool features: None
Lot
- Size: 0.25 Acres
- Dimensions: 95 x 118
- Features: Other (See Remarks)
Details
- Parcel number: 088012 A00012
Construction
Type & style
- Home type: SingleFamily
- Architectural style: Traditional
- Property subtype: Single Family Residence
Materials
- Vinyl Siding
Condition
- New construction: No
- Year built: 1978
Community & HOA
Community
- Subdivision: Stage Park Annexed Sec B
Location
- Region: Memphis
Financial & listing details
- Price per square foot: $28/sqft
- Tax assessed value: $184,100
- Annual tax amount: $2,426
- Price range: $49.9K - $49.9K
- Date on market: 10/9/2026
- Cumulative days on market: 30 days
Estimated market value
Not available
Estimated sales range
Not available
$1,620/mo
Price history
| Date | Event | Price |
|---|---|---|
| 10/28/2026 | Pending sale | $49,900$28/sqft |
Source:  MAAR #10232100 Report a problem | ||
| 10/9/2026 | Listed for sale | $49,900-24.5%$28/sqft |
Source: MAAR #10232100 Report a problem | ||
| 1/2/2025 | Listing removed | $1,595$1/sqft |
Source: Zillow Rentals Report a problem | ||
| 12/30/2024 | Price change | $1,595+0.3%$1/sqft |
Source: Zillow Rentals Report a problem | ||
| 12/24/2024 | Price change | $1,590+0.3%$1/sqft |
Source: Zillow Rentals Report a problem | ||
| 12/18/2024 | Price change | $1,585-1.9%$1/sqft |
Source: Zillow Rentals Report a problem | ||
| 12/14/2024 | Price change | $1,615-0.9%$1/sqft |
Source: Zillow Rentals Report a problem | ||
| 12/8/2024 | Price change | $1,630-0.3%$1/sqft |
Source: Zillow Rentals Report a problem | ||
| 12/7/2024 | Price change | $1,635-1.5%$1/sqft |
Source: Zillow Rentals Report a problem | ||
| 12/3/2024 | Price change | $1,660-2.4%$1/sqft |
Source: Zillow Rentals Report a problem | ||
| 11/29/2024 | Price change | $1,700-0.9%$1/sqft |
Source: Zillow Rentals Report a problem | ||
| 11/28/2024 | Price change | $1,715-0.3%$1/sqft |
Source: Zillow Rentals Report a problem | ||
| 11/25/2024 | Price change | $1,720+3%$1/sqft |
Source: Zillow Rentals Report a problem | ||
| 11/22/2024 | Price change | $1,670-0.6%$1/sqft |
Source: Zillow Rentals Report a problem | ||
| 11/19/2024 | Price change | $1,680+0.9%$1/sqft |
Source: Zillow Rentals Report a problem | ||
| 11/17/2024 | Price change | $1,665-2.6%$1/sqft |
Source: Zillow Rentals Report a problem | ||
| 11/15/2024 | Price change | $1,710-0.3%$1/sqft |
Source: Zillow Rentals Report a problem | ||
| 11/10/2024 | Price change | $1,715-1.2%$1/sqft |
Source: Zillow Rentals Report a problem | ||
| 11/6/2024 | Price change | $1,735+0.6%$1/sqft |
Source: Zillow Rentals Report a problem | ||
| 11/4/2024 | Price change | $1,725+0.3%$1/sqft |
Source: Zillow Rentals Report a problem | ||
| 10/30/2024 | Price change | $1,720-0.9%$1/sqft |
Source: Zillow Rentals Report a problem | ||
| 10/28/2024 | Price change | $1,735+0.3%$1/sqft |
Source: Zillow Rentals Report a problem | ||
| 10/26/2024 | Price change | $1,730-0.3%$1/sqft |
Source: Zillow Rentals Report a problem | ||
| 10/25/2024 | Price change | $1,735+2.4%$1/sqft |
Source: Zillow Rentals Report a problem | ||
| 10/17/2024 | Listed for rent | $1,695$1/sqft |
Source: Zillow Rentals Report a problem | ||
| 9/13/2016 | Sold | $66,100+2.5%$37/sqft |
Source: MAAR #9983318 Report a problem | ||
| 6/29/2012 | Sold | $64,500+51.8%$36/sqft |
Source: Public Record Report a problem | ||
| 4/4/2012 | Sold | $42,500-56.6%$24/sqft |
Source: MAAR #3239823 Report a problem | ||
| 9/1/2009 | Sold | $98,000+53.1%$54/sqft |
Source: Public Record Report a problem | ||
| 7/11/2008 | Sold | $64,000$36/sqft |
Source: Public Record Report a problem | ||
Public tax history
| Year | Property taxes | Tax assessment |
|---|---|---|
| 2025 | $2,426 +17.1% | $46,025 +46.3% |
| 2024 | $2,071 +8.1% | $31,450 |
| 2023 | $1,916 | $31,450 |
| 2022 | -- | $31,450 |
| 2021 | -- | $31,450 +42.8% |
| 2020 | $704 | $22,025 |
| 2019 | $704 -21.1% | $22,025 |
| 2018 | $892 -45.1% | $22,025 |
| 2017 | $1,626 +137% | $22,025 +9.2% |
| 2016 | $686 -29.1% | $20,175 |
| 2014 | $968 | $20,175 |
| 2013 | -- | $20,175 -33.5% |
| 2012 | -- | $30,350 |
| 2011 | -- | $30,350 |
| 2010 | -- | $30,350 |
| 2009 | -- | $30,350 +7.5% |
| 2008 | -- | $28,225 |
| 2007 | -- | $28,225 |
| 2006 | -- | $28,225 |
| 2005 | -- | $28,225 +7.3% |
| 2004 | -- | $26,300 |
| 2003 | -- | $26,300 |
| 2002 | -- | $26,300 |
| 2001 | -- | $26,300 -0.5% |
| 2000 | -- | $26,425 |
Find assessor info on the county website
Monthly payment
Est. payment
Payment breakdown
Explore the cost of this home by adjusting the details. Changes won't be saved.Climate risks
Neighborhood: Raleigh
Similar homes
- $49,9003 bd2 ba1.7k sqft3946 Balfour St, Memphis, TN 38127For Sale
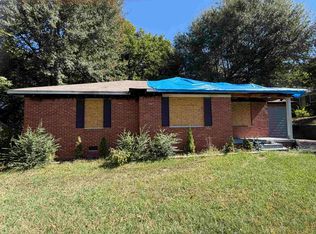 MLS ID #10233723, Laksh Nandrajog, Renshaw Company, REALTORS. MAAR
- $49,9002 bd2 ba1.4k sqft3522 Debby Dr, Memphis, TN 38127For Sale
 MLS ID #10233000, Tyler Tapley, Crye-Leike, Inc., REALTORS. MAAR
- $55,0003 bd1 ba931 sqft3621 Royal Wood Dr, Memphis, TN 38128For Sale
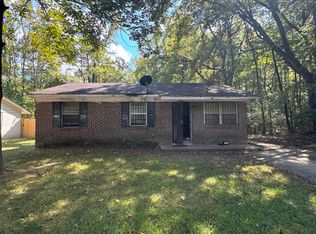 MLS ID #10233816, Amanda J Rathbone McGill, KAIZEN Realty, LLC. MAAR
- $50,0003 bd2 ba1.5k sqft2204 Clayton Ave, Memphis, TN 38108For Sale
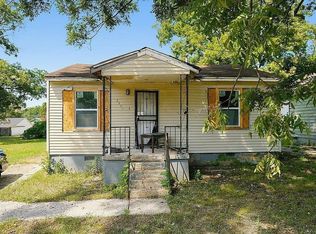 MLS ID #10232020, Donnie K Morrow, eXp Realty, LLC. MAAR
