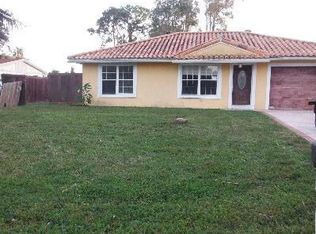
NO HOA! Needs some TLC. 3BR/1BA Delray Beach home is just 5 miles to the beach and 4 miles to Downtown Delray. Enjoy true Florida living with a large fenced backyard--perfect for entertaining, pets, or adding a pool. Bright, open living spaces and endless potential make this the perfect starter home, Airbnb, or investment property. Freedom, location, and lifestyle all in one--no HOA, no restrictions! Live minutes from Atlantic Ave, shopping, dining, and the sand. Addotional room/laundry room with a door to backyard. No laundry hook ups , can be added
Pre-foreclosure
Est. $420,055
5196 Palm Ridge Blvd, Delray Beach, FL 33484
3beds
1,641sqft
Single Family Residence
Built in 1975
-- sqft lot
$-- Zestimate®
$256/sqft
$-- HOA
Overview
- 24 days |
- 97 |
- 6 |
Zillow last checked:
Source: Illustrated Properties,MLS#: R11134041
Facts & features
Interior
Bedrooms & bathrooms
- Bedrooms: 3
- Bathrooms: 1
- Full bathrooms: 1
Features
- Has basement: No
Interior area
- Total structure area: 1,641
- Total interior livable area: 1,641 sqft
Property
Details
- Parcel number: 00424611020001240
Construction
Type & style
- Home type: SingleFamily
- Property subtype: Single Family Residence
Condition
- Year built: 1975
Community & HOA
Location
- Region: Delray Beach
Financial & listing details
- Price per square foot: $256/sqft
- Tax assessed value: $420,055
- Annual tax amount: $7,296
- Date on market: 10/21/2025
- Lease term: Contact For Details
Visit our professional directory to find a foreclosure specialist in your area that can help with your home search.
Find a foreclosure agentForeclosure details
Estimated market value
Not available
Estimated sales range
Not available
$2,510/mo
Price history
| Date | Event | Price |
|---|---|---|
| 2/6/2026 | Listing removed | $485,000$296/sqft |
Source: Illustrated Properties #R11134041 Report a problem | ||
| 11/18/2025 | Price change | $485,000-1%$296/sqft |
Source: | ||
| 10/21/2025 | Listed for sale | $490,000+92.2%$299/sqft |
Source: | ||
| 4/21/2019 | Listing removed | $255,000$155/sqft |
Source: Atlantic Florida Properties #RX-10477250 Report a problem | ||
| 11/5/2018 | Price change | $255,000-3.8%$155/sqft |
Source: Atlantic Florida Properties #RX-10477250 Report a problem | ||
| 11/1/2018 | Listed for sale | $265,000+154.8%$161/sqft |
Source: Atlantic Florida Properties #RX-10477250 Report a problem | ||
| 2/10/2012 | Listing removed | $103,999$63/sqft |
Source: Rising Realty #R3165560 Report a problem | ||
| 2/9/2011 | Listed for sale | $103,999-64.7%$63/sqft |
Source: Engel & Volkers Jupiter Real Estate #R3165560 Report a problem | ||
| 12/27/2005 | Sold | $295,000+63.9%$180/sqft |
Source: Public Record Report a problem | ||
| 5/25/2004 | Sold | $180,000+105.7%$110/sqft |
Source: Public Record Report a problem | ||
| 10/14/2003 | Sold | $87,500+30.6%$53/sqft |
Source: Public Record Report a problem | ||
| 6/11/2002 | Sold | $67,000+21.8%$41/sqft |
Source: Public Record Report a problem | ||
| 12/10/1998 | Sold | $55,000+17%$34/sqft |
Source: Public Record Report a problem | ||
| 1/9/1998 | Sold | $47,000$29/sqft |
Source: Public Record Report a problem | ||
Public tax history
| Year | Property taxes | Tax assessment |
|---|---|---|
| 2025 | $7,296 -2.2% | $420,055 -2.5% |
| 2024 | $7,458 +94.3% | $430,633 +74% |
| 2023 | $3,838 +1.1% | $247,491 +3% |
| 2022 | $3,796 +1% | $240,283 +3% |
| 2021 | $3,759 -6% | $233,284 +1.4% |
| 2020 | $3,998 -5.4% | $230,063 +18.2% |
| 2019 | $4,227 | $194,624 +10% |
| 2018 | $4,227 +14% | $176,931 -1.9% |
| 2017 | $3,709 -2.3% | $180,435 +77.7% |
| 2016 | $3,796 +118.4% | $101,515 +0.7% |
| 2015 | $1,738 -1.6% | $100,809 +0.8% |
| 2014 | $1,765 +1.8% | $100,009 +1.5% |
| 2013 | $1,734 +1% | $98,531 +1.7% |
| 2012 | $1,716 -14% | $96,884 -11.6% |
| 2011 | $1,995 -14.9% | $109,552 -13.9% |
| 2010 | $2,344 -3% | $127,272 -14.9% |
| 2009 | $2,415 -40.1% | $149,592 -26.7% |
| 2008 | $4,031 -4.1% | $204,210 -6.7% |
| 2007 | $4,204 -12.5% | $218,833 -5.5% |
| 2006 | $4,802 | $231,680 +45.8% |
| 2005 | -- | $158,910 +19.2% |
| 2004 | $1,383 +514.4% | $133,267 +13.9% |
| 2003 | $225 -89.4% | $117,045 +20.3% |
| 2002 | $2,132 +10.5% | $97,331 +13.1% |
| 2001 | $1,930 +15.7% | $86,071 +16.2% |
| 2000 | $1,668 +25.3% | $74,046 +8.5% |
| 1999 | $1,331 | $68,230 |
Find assessor info on the county website
Monthly payment
Estimated monthly payment$1,822
All calculations are estimates and provided by Zillow, Inc. for informational purposes only. Actual amounts may vary.
HOA fees may include property taxes on listings classified as Co-Ops. Contact the listing agent and/or owner for fee details.
Mortgage interest rates are dependent on a number of factors, including credit score, down payment, and repayment length. Interest rate data provided by Zillow Group Marketplace, Inc. as of 1/1/1970 from various mortgage lenders with which we have lead or other similar arrangements; the Estimated Payment is an average of those rates.
See how much you could borrow to make a competitive offer.
Climate risks
Neighborhood: 33484
Nearby schools
GreatSchools rating
- 8/10Banyan Creek Elementary SchoolGrades: PK-5Distance: 0.8 mi
- 3/10Carver Middle SchoolGrades: 6-8Distance: 1.5 mi
- 5/10Atlantic High SchoolGrades: 9-12Distance: 2.1 mi


- Florida
- Palm Beach County
- Delray Beach
- 33484
- 5196 Palm Ridge Blvd
Nearby cities
Nearby neighborhoods
Nearby zip codes
Other Delray Beach Topics
