$291,400
-- bd|2 ba|1.3k sqft
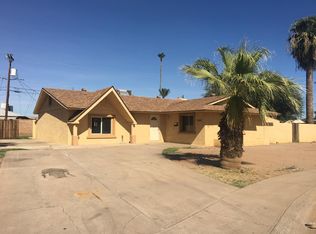
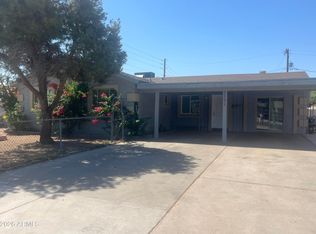
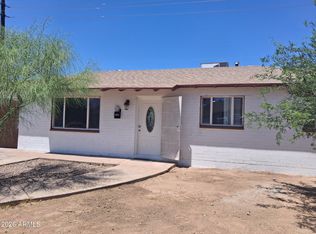
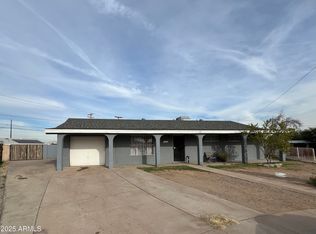
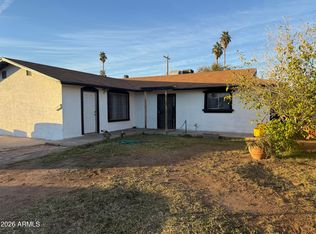
5435 W Osborn Rd, Phoenix, AZ 85031
Off Market
Likely to sell faster than
Zillow last checked:
Listing updated:
Viviana Luera 623-670-1809,
HomeSmart,
Barbara J Eggum 951-217-0479,
HomeSmart

$310,700
$295,000 - $326,000
$1,982/mo
| Date | Event | Price |
|---|---|---|
| 5/15/2026 | Price change | $310,900-0.6%$197/sqft |
Source: | ||
| 5/1/2026 | Listed for sale | $312,900-5.2%$199/sqft |
Source: | ||
| 3/5/2026 | Listing removed | $330,000$210/sqft |
Source: eXp Realty #6930103 Report a problem | ||
| 10/9/2025 | Listed for sale | $330,000+8.2%$210/sqft |
Source: | ||
| 11/26/2024 | Listing removed | $305,000$194/sqft |
Source: | ||
| 11/24/2024 | Listed for sale | $305,000+64.9%$194/sqft |
Source: | ||
| 5/27/2019 | Sold | $185,000-4.1%$117/sqft |
Source: | ||
| 4/27/2019 | Pending sale | $192,900$122/sqft |
Source: HomeSmart #5906593 Report a problem | ||
| 4/16/2019 | Price change | $192,900-1.5%$122/sqft |
Source: HomeSmart #5906593 Report a problem | ||
| 4/5/2019 | Listed for sale | $195,900+291.8%$124/sqft |
Source: HomeSmart #5906593 Report a problem | ||
| 6/15/2012 | Sold | $50,000+150%$32/sqft |
Source: | ||
| 4/25/2012 | Listed for sale | $20,000-90.9%$13/sqft |
Source: Keller Williams Realty Report a problem | ||
| 5/6/2010 | Sold | $219,059+6.9%$139/sqft |
Source: Public Record Report a problem | ||
| 4/12/2007 | Sold | $205,000+24.3%$130/sqft |
Source: Public Record Report a problem | ||
| 12/28/2006 | Sold | $164,900+49.9%$105/sqft |
Source: Public Record Report a problem | ||
| 5/15/2003 | Sold | $110,000$70/sqft |
Source: Public Record Report a problem | ||
| Year | Property taxes | Tax assessment |
|---|---|---|
| 2025 | $857 +2.8% | $25,920 -8.4% |
| 2024 | $833 -2.6% | $28,300 +474.2% |
| 2023 | $855 +5.4% | $4,929 -71.9% |
| 2022 | $811 +3.8% | $17,560 +13.2% |
| 2021 | $782 +4.8% | $15,510 +11.3% |
| 2020 | $746 -12.4% | $13,930 +17.3% |
| 2019 | $851 | $11,880 +13.7% |
| 2018 | $851 +3.4% | $10,450 +21.8% |
| 2017 | $823 +12.1% | $8,580 +14.4% |
| 2016 | $735 -2.4% | $7,500 +17.6% |
| 2015 | $753 | $6,380 +54.5% |
| 2014 | -- | $4,130 +44.4% |
| 2013 | -- | $2,860 -2.4% |
| 2012 | -- | $2,930 -7.9% |
| 2011 | -- | $3,180 -41.1% |
| 2010 | -- | $5,400 -62% |
| 2009 | -- | $14,210 -7.1% |
| 2008 | -- | $15,300 +27% |
| 2007 | -- | $12,050 +40.9% |
| 2006 | -- | $8,550 |
| 2005 | -- | $8,550 +47.4% |
| 2004 | -- | $5,800 |
| 2003 | -- | $5,800 |
| 2002 | -- | $5,800 |
Find assessor info on the county website
Source: ARMLS. This data may not be complete. We recommend contacting the local school district to confirm school assignments for this home.
A local agent can set up tours, give advice and negotiate with sellers.