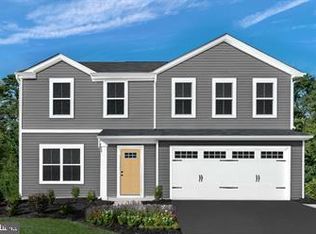
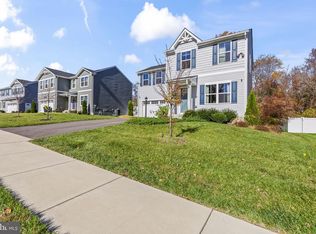
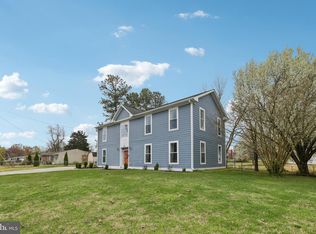
Welcome to 5503 Vergo Rd, a beautifully maintained **move-in-ready** single-family home built in 2022, offering 4 bedrooms, 2.5 baths, and a 2-car garage in the sought-after Pientanza Woods community in Capitol Heights. If you're looking for a newer construction home in PG County, this is the home for you! The main level features a bright, open-concept layout with a spacious living area, a convenient powder room, and a sleek, modern kitchen perfect for both daily living and entertaining. Upstairs, you’ll find four generously sized bedrooms along with the ease of bedroom-level laundry. Conveniently located with easy access to I-495, Central Avenue, Washington, DC, and close proximity to the Capitol Heights and Addison Rd Metro Stations, this home offers both comfort and convenience.
Under contract
Est. $539,900
5503 Vergo Rd, Capitol Heights, MD 20743
4beds
2,203sqft
Single Family Residence
Built in 2022
-- sqft lot
$-- Zestimate®
$245/sqft
$100/mo HOA
Overview
- 17 days |
- 352 |
- 37 |
Zillow last checked: 7 hours ago
Listing updated: April 07, 2026 at 08:59am
Listed by:
Katelyn Moon 443-823-3701,
Realty 1 Maryland, LLC 410-707-7448
Source: Bright MLS,MLS#: MDPG2195228
Facts & features
Interior
Bedrooms & bathrooms
- Bedrooms: 4
- Bathrooms: 3
- Full bathrooms: 2
- 1/2 bathrooms: 1
- Main level bathrooms: 1
Rooms
- Room types: Basement, Loft
Basement
- Features: Basement - Unfinished
- Level: Lower
Loft
- Level: Upper
Heating
- Central, Natural Gas
Cooling
- Central Air, Electric
Appliances
- Included: Tankless Water Heater
- Laundry: Hookup, Upper Level
Features
- Flooring: Carpet, Luxury Vinyl
- Basement: Concrete,Unfinished
- Has fireplace: No
Interior area
- Total structure area: 3,295
- Total interior livable area: 2,203 sqft
- Finished area above ground: 2,203
Property
Parking
- Total spaces: 2
- Parking features: Garage Door Opener, Garage Faces Front, Attached, Driveway
- Attached garage spaces: 2
- Has uncovered spaces: Yes
Accessibility
- Accessibility features: None
Features
- Levels: Three
- Stories: 3
- Pool features: None
Details
- Additional structures: Above Grade
- Parcel number: 17183949641
- Zoning: RES
- Special conditions: Standard
Construction
Type & style
- Home type: SingleFamily
- Architectural style: Craftsman
- Property subtype: Single Family Residence
Materials
- Vinyl Siding
- Foundation: Concrete Perimeter
Condition
- New construction: No
- Year built: 2022
Details
- Builder model: Elm
- Builder name: Ryan Homes
Utilities & green energy
- Sewer: Public Sewer
- Water: Public
Community & HOA
Community
- Subdivision: Pientanza Woods
HOA
- Has HOA: Yes
- HOA fee: $100 monthly
Location
- Region: Capitol Heights
Financial & listing details
- Price per square foot: $245/sqft
- Tax assessed value: $546,000
- Annual tax amount: $8,492
- Date on market: 3/25/2026
- Listing agreement: Exclusive Right To Sell
- Ownership: Fee Simple

Katelyn Moon
(443) 823-3701
By pressing Contact Agent, you agree that the real estate professional identified above may call/text you about your search, which may involve use of automated means and pre-recorded/artificial voices. You don't need to consent as a condition of buying any property, goods, or services. Message/data rates may apply. You also agree to our Terms of Use. Zillow does not endorse any real estate professionals. We may share information about your recent and future site activity with your agent to help them understand what you're looking for in a home.
Foreclosure details
Estimated market value
Not available
Estimated sales range
Not available
$3,269/mo
Price history
Price history
| Date | Event | Price |
|---|---|---|
| 4/6/2026 | Contingent | $539,900$245/sqft |
Source: | ||
| 3/26/2026 | Listed for sale | $539,900+33.3%$245/sqft |
Source: | ||
| 2/5/2026 | Sold | $405,150-26.3%$184/sqft |
Source: Public Record Report a problem | ||
| 11/17/2022 | Sold | $549,990$250/sqft |
Source: | ||
| 7/24/2022 | Pending sale | $549,990$250/sqft |
Source: | ||
Public tax history
Public tax history
| Year | Property taxes | Tax assessment |
|---|---|---|
| 2025 | $8,492 +40.7% | $546,000 +0.6% |
| 2024 | $6,036 +0.6% | $542,800 +0.6% |
| 2023 | $6,000 +1212.9% | $539,600 +1212.9% |
| 2022 | $457 +10% | $41,100 +10% |
| 2021 | $416 +5.3% | $37,367 +5.3% |
| 2020 | $395 +50.1% | $35,500 +100.6% |
| 2019 | $263 | $17,700 |
| 2018 | $263 +101.1% | $17,700 +101.1% |
| 2017 | $131 +2.8% | $8,800 |
| 2016 | $127 | $8,800 |
| 2015 | $127 | $8,800 |
| 2014 | $127 | $8,800 |
| 2013 | -- | $8,800 |
| 2012 | -- | $8,800 -1% |
| 2011 | -- | $8,890 |
| 2010 | -- | $8,890 |
| 2009 | -- | $8,890 |
Find assessor info on the county website
Monthly payment
Estimated monthly payment
All calculations are estimates and provided by Zillow, Inc. for informational purposes only. Actual amounts may vary.
HOA fees may include property taxes on listings classified as Co-Ops. Contact the listing agent and/or owner for fee details.
Mortgage interest rates are dependent on a number of factors, including credit score, down payment, and repayment length. Interest rate data provided by Zillow Group Marketplace, Inc. as of 1/1/1970 from various mortgage lenders with which we have lead or other similar arrangements; the Estimated Payment is an average of those rates.
See how much you could borrow to make a competitive offer.
Climate risks
Neighborhood: 20743
Nearby schools
GreatSchools rating
- 5/10Doswell E. Brooks Elementary SchoolGrades: PK-6Distance: 0.3 mi
- 3/10Walker Mill Middle SchoolGrades: 6-8Distance: 1.5 mi
- 2/10Suitland High SchoolGrades: 9-12Distance: 1.5 mi
Schools provided by the listing agent
- District: Prince George's County Public Schools
Source: Bright MLS. This data may not be complete. We recommend contacting the local school district to confirm school assignments for this home.

- Maryland
- Prince Georges County
- Coral Hills
- 20743
- 5503 Vergo Rd
Nearby cities
Nearby zip codes
Other Coral Hills Topics
