Investor special with exceptional potential! This property is a prime opportunity for investors, flippers, or builders looking for their next project. The home is in need of a complete renovation and is being sold as-is, making it ideal for a full remodel or possible tear-down and new construction. OWNER FINACING AVAILABLE WITH 20% DOWN BRING ALL OFFERS. Owner financing available with 20% down BRING ALL OFFERS!
For sale
Price cut: $8K (8/24)
$39,900
2201 N Woodland St, Amarillo, TX 79107
3beds
1,486sqft
Single Family Residence
Built in 1954
594 Square Feet Lot
$-- Zestimate®
$27/sqft
$-- HOA
What's special
- 91 days
- 254
- 6
Zillow last checked:
Listing updated:
Listed by:
Nicklas Espinosa 806-420-1141,
Keller Williams Realty Amarillo
Source: AMMLS,MLS#: 26-5797
Facts & features
Interior
Bedrooms & bathrooms
- Bedrooms: 3
- Bathrooms: 1
- Full bathrooms: 2
Interior area
- Total structure area: 1,486
- Total interior livable area: 1,486 sqft
Property
Lot
- Size: 594 Square Feet
- Dimensions: 5.40 x 110.00
Details
- Parcel number: R044850017890
- Zoning description: 0300 - NE Amarillo in City Limits
Construction
Type & style
- Home type: SingleFamily
- Property subtype: Single Family Residence
Condition
- New construction: No
- Year built: 1954
Community & HOA
HOA
- Has HOA: No
Location
- Region: Amarillo
Financial & listing details
- Price per square foot: $27/sqft
- Tax assessed value: $61,006
- Date on market: 7/20/2026
- Listing terms: FHA,Conventional
Estimated market value
Not available
Estimated sales range
Not available
$1,295/mo
Price history
| Date | Event | Price |
|---|---|---|
| 8/24/2026 | Price change | $39,900-16.7%$27/sqft |
Source:  AMMLS #26-5797 Report a problem | ||
| 7/20/2026 | Listed for sale | $47,900$32/sqft |
Source: AMMLS #26-5797 Report a problem | ||
Public tax history
| Year | Property taxes | Tax assessment |
|---|---|---|
| 2026 | -- | $61,006 -1.8% |
| 2025 | $1,318 +3% | $62,148 +1% |
| 2024 | $1,280 +4.6% | $61,557 +8.9% |
| 2023 | $1,223 -3% | $56,535 +6.3% |
| 2022 | $1,261 +22.3% | $53,178 +30% |
| 2021 | $1,031 +1.7% | $40,908 +0.1% |
| 2020 | $1,014 +202.6% | $40,863 +204.5% |
| 2019 | $335 +0.3% | $13,421 +0.8% |
| 2018 | $334 +2.7% | $13,315 -0.2% |
| 2017 | $325 +3.6% | $13,339 +8.1% |
| 2016 | $314 -98.8% | $12,336 |
| 2015 | $27,265 +8673.4% | $12,336 -5.4% |
| 2014 | $311 | $13,038 -60% |
| 2013 | -- | $32,594 |
| 2012 | -- | $32,594 |
| 2011 | -- | $32,594 |
| 2010 | -- | $32,594 |
| 2009 | -- | $32,594 |
| 2008 | -- | -- |
| 2007 | -- | -- |
| 2006 | -- | -- |
| 2005 | -- | -- |
| 2004 | -- | -- |
| 2003 | -- | -- |
| 2002 | -- | $46,615 |
| 2001 | -- | $46,615 |
Find assessor info on the county website
Monthly payment
Est. payment
Payment breakdown
Explore the cost of this home by adjusting the details. Changes won't be saved.Climate risks
Neighborhood: 79107

Similar homes
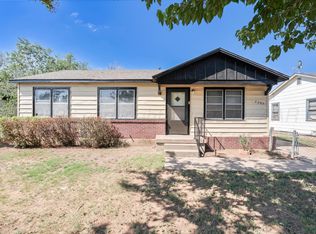
- $39,9003 bd1 ba1.6k sqft1906 N Washington St, Amarillo, TX 79107For Sale
 MLS ID #26-3651, John Darren Walker, J. Walker Realty, LLC. AMMLS
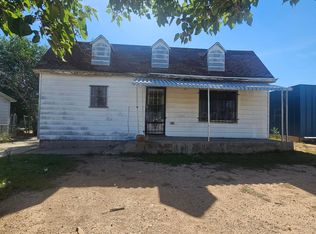
- $39,9004 bd2 ba1.3k sqft1407 Carter St, Amarillo, TX 79104For Sale
 MLS ID #26-4306, Nicklas Espinosa, Keller Williams Realty Amarillo. AMMLS
- $32,000-- bd2 ba1.2k sqft2014 Hawk Ln, Amarillo, TX 79118For Sale
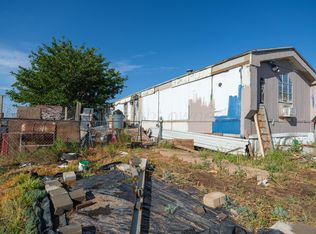 MLS ID #26-7093, Carlos Villalobos, EXP Realty, LLC. AMMLS
- $49,7002 bd1 ba1.2k sqft3404 S Tyler St, Amarillo, TX 79109For Sale
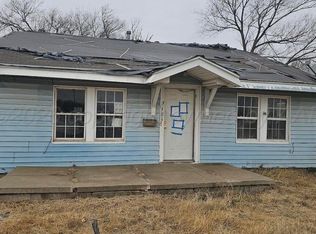 MLS ID #26-6134, Brandon Stewart, Blaze Real Estate. AMMLS
