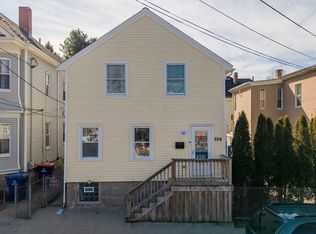
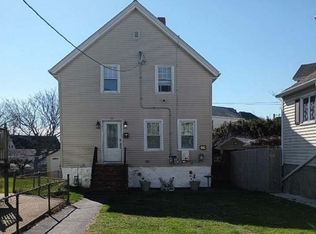
Single family rental. Newly renovated with 2 bedrooms and 1.5 bathrooms. Large yard with potential for off street parking. Contact listing agent for more information.
Under contract
$389,000
19 Jenney St, New Bedford, MA 02740
2beds
947sqft
Est.:
Single Family Residence
Built in 1901
3,833 Square Feet Lot
$403,600 Zestimate®
$411/sqft
$-- HOA
What's special
Large yardNewly renovated
- 13 days |
- 623 |
- 51 |
Likely to sell faster than
Zillow last checked:
Listing updated:
Listed by:
Aaron Araujo 508-742-7462,
RE/MAX Vantage 774-992-0297
Source: MLS PIN,MLS#: 73503148
Facts & features
Interior
Bedrooms & bathrooms
- Bedrooms: 2
- Bathrooms: 2
- Full bathrooms: 1
- 1/2 bathrooms: 1
Heating
- Electric Baseboard
Cooling
- Window Unit(s)
Appliances
- Included: Electric Water Heater, Range, Dishwasher, Microwave, Refrigerator
Features
- Flooring: Wood
- Has basement: No
- Has fireplace: No
Interior area
- Total structure area: 947
- Total interior livable area: 947 sqft
- Finished area above ground: 947
Property
Parking
- Parking features: Open
- Has uncovered spaces: Yes
Features
- Patio & porch: Porch
- Exterior features: Porch
- Fencing: Fenced/Enclosed
Lot
- Size: 3,833 Square Feet
Details
- Parcel number: 2891305
- Zoning: RB
Construction
Type & style
- Home type: SingleFamily
- Architectural style: Other (See Remarks)
- Property subtype: Single Family Residence
Materials
- Post & Beam, Conventional (2x4-2x6)
- Foundation: Stone
- Roof: Shingle
Condition
- Year built: 1901
Utilities & green energy
- Electric: Circuit Breakers, 200+ Amp Service
- Sewer: Public Sewer
- Water: Public
Community & HOA
Community
- Features: Public Transportation, Park
HOA
- Has HOA: No
Location
- Region: New Bedford
Financial & listing details
- Price per square foot: $411/sqft
- Tax assessed value: $275,500
- Annual tax amount: $3,118
- Date on market: 4/16/2026
- Listing terms: Contract
Estimated market value
$403,600
$383,000 - $424,000
$1,993/mo
Price history
| Date | Event | Price |
|---|---|---|
| 4/23/2026 | Contingent | $389,000$411/sqft |
Source: MLS PIN #73503148 Report a problem | ||
| 4/16/2026 | Listed for sale | $389,000-6.3%$411/sqft |
Source: MLS PIN #73503148 Report a problem | ||
| 1/21/2026 | Listing removed | $415,000$438/sqft |
Source: MLS PIN #73463370 Report a problem | ||
| 1/9/2026 | Contingent | $415,000$438/sqft |
Source: MLS PIN #73463370 Report a problem | ||
| 12/22/2025 | Listed for sale | $415,000+107.5%$438/sqft |
Source: MLS PIN #73463370 Report a problem | ||
| 6/3/2022 | Listing removed | -- |
Source: MLS PIN #72935035 Report a problem | ||
| 2/21/2022 | Price change | $199,990-2.8%$211/sqft |
Source: MLS PIN #72935035 Report a problem | ||
| 2/1/2022 | Price change | $205,700-1.8%$217/sqft |
Source: MLS PIN #72935035 Report a problem | ||
| 1/28/2022 | Price change | $209,500-2.6%$221/sqft |
Source: MLS PIN #72935035 Report a problem | ||
| 1/23/2022 | Price change | $215,000-1.8%$227/sqft |
Source: MLS PIN #72935035 Report a problem | ||
| 1/19/2022 | Listed for sale | $219,000+36.9%$231/sqft |
Source: MLS PIN #72935035 Report a problem | ||
| 11/8/2021 | Sold | $160,000$169/sqft |
Source: MLS PIN #72900884 Report a problem | ||
| 10/4/2021 | Contingent | $160,000$169/sqft |
Source: MLS PIN #72900884 Report a problem | ||
| 9/27/2021 | Listed for sale | $160,000+146.2%$169/sqft |
Source: MLS PIN #72900884 Report a problem | ||
| 9/28/1989 | Sold | $65,000$69/sqft |
Source: Public Record Report a problem | ||
Public tax history
| Year | Property taxes | Tax assessment |
|---|---|---|
| 2025 | $3,118 +17.1% | $275,700 +24.3% |
| 2024 | $2,662 -9.7% | $221,800 +7.5% |
| 2023 | $2,948 +11.7% | $206,300 +21.5% |
| 2022 | $2,639 +5% | $169,800 +5.3% |
| 2021 | $2,513 +0.9% | $161,200 +4.6% |
| 2020 | $2,490 +1.7% | $154,100 +3.6% |
| 2019 | $2,449 +5.9% | $148,700 +7% |
| 2018 | $2,312 +7.1% | $139,000 +7.5% |
| 2017 | $2,158 +6.4% | $129,300 +5.1% |
| 2016 | $2,028 +8.5% | $123,000 +3.5% |
| 2015 | $1,869 +7% | $118,800 +3.1% |
| 2014 | $1,746 -2.1% | $115,200 -7.4% |
| 2013 | $1,783 +1.2% | $124,400 -2.8% |
| 2012 | $1,761 -17% | $128,000 -22.3% |
| 2011 | $2,121 -10.1% | $164,700 -16% |
| 2010 | $2,359 +9.7% | $196,100 +4.4% |
| 2009 | $2,151 +9.8% | $187,900 +1.2% |
| 2008 | $1,959 -2.2% | $185,700 -4.4% |
| 2007 | $2,003 +25.7% | $194,300 +32.5% |
| 2006 | $1,594 -3.5% | $146,600 +0.9% |
| 2005 | $1,652 +12.5% | $145,300 +22.4% |
| 2004 | $1,468 +17.6% | $118,700 +39.5% |
| 2003 | $1,248 +13.1% | $85,100 +18.9% |
| 2002 | $1,103 +5.9% | $71,600 +11.5% |
| 2000 | $1,042 +8.7% | $64,200 -11.2% |
| 1996 | $959 | $72,300 |
Find assessor info on the county website
Monthly payment
Est. payment
$2,237/mo
Principal & interest
$1897
Property taxes
$340
More affordability tools
Climate risks
Neighborhood: 02740
Nearby schools
GreatSchools rating
- 2/10Thomas R Rodman Elementary SchoolGrades: K-5Distance: 0.3 mi
- 3/10Keith Middle SchoolGrades: 6-8Distance: 0.9 mi
- 1/10New Bedford High SchoolGrades: 9-12Distance: 0.8 mi
A local agent can set up tours, give advice and negotiate with sellers.
A local lender can help you make sure your offer is ready when you are.
- Massachusetts
- Bristol County
- New Bedford
- 02740
- 19 Jenney St
Nearby cities
Nearby zip codes
Other New Bedford Topics
