$53,000
-- bd|1 ba|1.3k sqft
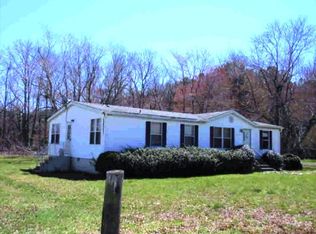
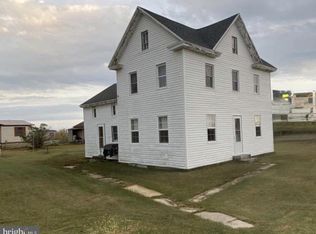
5612 Tulls Corner Rd, Marion Station, MD 21838
Off Market
Zillow last checked: 7 hours ago
Listing updated: January 29, 2026 at 02:11am
Alexander McKenzie 410-546-3211,
Long & Foster Real Estate, Inc. 4105463211
Not available
Estimated sales range
Not available
$1,842/mo
| Date | Event | Price |
|---|---|---|
| 12/15/2025 | Listed for sale | $65,000$46/sqft |
Source: | ||
| 11/21/2025 | Listing removed | $65,000$46/sqft |
Source: | ||
| 4/9/2025 | Price change | $65,000-23.5%$46/sqft |
Source: | ||
| 11/20/2024 | Listed for sale | $85,000+6.3%$61/sqft |
Source: | ||
| 12/12/2023 | Sold | $80,000+131.9%$57/sqft |
Source: Public Record Report a problem | ||
| 12/9/2022 | Sold | $34,500-13.5%$25/sqft |
Source: | ||
| 10/27/2022 | Pending sale | $39,900$29/sqft |
Source: | ||
| 10/10/2022 | Price change | $39,900-11.1%$29/sqft |
Source: | ||
| 10/7/2022 | Listed for sale | $44,900$32/sqft |
Source: | ||
| 9/21/2022 | Pending sale | $44,900$32/sqft |
Source: | ||
| 9/10/2022 | Price change | $44,900-10%$32/sqft |
Source: | ||
| 8/23/2022 | Price change | $49,900-16.7%$36/sqft |
Source: | ||
| 7/20/2022 | Price change | $59,900-7.8%$43/sqft |
Source: | ||
| 6/28/2022 | Price change | $65,000-3%$46/sqft |
Source: | ||
| 6/13/2022 | Price change | $67,000-2.2%$48/sqft |
Source: | ||
| 5/11/2022 | Price change | $68,500-2.1%$49/sqft |
Source: | ||
| 4/20/2022 | Price change | $70,000-3.4%$50/sqft |
Source: | ||
| 3/17/2022 | Pending sale | $72,500$52/sqft |
Source: | ||
| 3/16/2022 | Price change | $72,500-3.3%$52/sqft |
Source: | ||
| 2/18/2022 | Listed for sale | $75,000$54/sqft |
Source: | ||
| Year | Property taxes | Tax assessment |
|---|---|---|
| 2025 | $1,849 +218.7% | $61,600 +18.1% |
| 2024 | $580 +22.1% | $52,167 +22.1% |
| 2023 | $475 +28.3% | $42,733 +28.3% |
| 2022 | $370 | $33,300 |
| 2021 | $370 | $33,300 |
| 2020 | $370 -2.1% | $33,300 -2.1% |
| 2019 | $378 | $34,000 |
| 2018 | $378 | $34,000 |
| 2017 | $378 -1.4% | $34,000 -1.4% |
| 2016 | $384 | $34,500 |
| 2015 | $384 -78.4% | $34,500 |
| 2014 | $1,774 | $34,500 -18.6% |
| 2013 | -- | $42,400 |
| 2012 | -- | $42,400 |
| 2011 | -- | $42,400 -43.1% |
| 2010 | -- | $74,560 +11.1% |
| 2009 | -- | $67,100 +12.5% |
| 2008 | -- | $59,640 +14.3% |
| 2007 | -- | $52,180 +13.4% |
| 2006 | -- | $46,000 +15.5% |
| 2005 | -- | $39,820 +18.4% |
| 2004 | -- | $33,640 +3% |
| 2003 | -- | $32,652 +3.1% |
| 2002 | -- | $31,666 +3.2% |
| 2001 | -- | $30,680 |
Find assessor info on the county website
Source: Bright MLS. This data may not be complete. We recommend contacting the local school district to confirm school assignments for this home.