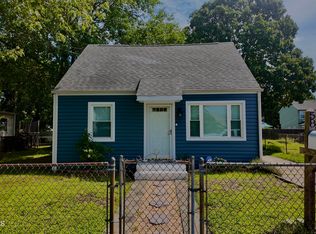
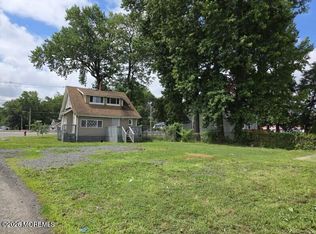
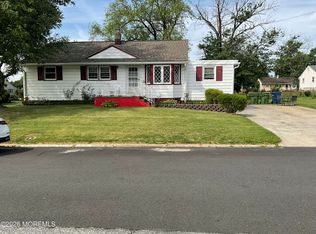
$515,800
3 bd1 ba912 sqft
578 Hopping Rd, Belford, NJ 07718
Off Market
Likely to sell faster than
Zillow last checked:
Listing updated:
Megan Arnold 732-687-8749,
C21/ Solid Gold Realty

$541,800
$515,000 - $569,000
$3,360/mo
| Date | Event | Price |
|---|---|---|
| 10/23/2026 | Pending sale | $545,000$399/sqft |
Source:  MoreMLS #22631103 Report a problem | ||
| 10/6/2026 | Price change | $545,000-0.9%$399/sqft |
Source: MoreMLS #22631103 Report a problem | ||
| 10/2/2026 | Listed for sale | $550,000$403/sqft |
Source: MoreMLS #22631103 Report a problem | ||
| 10/2/2026 | Listing removed | $550,000$403/sqft |
Source: MoreMLS #22605056 Report a problem | ||
| 9/28/2026 | Price change | $550,000-3.5%$403/sqft |
Source: MoreMLS #22605056 Report a problem | ||
| 9/16/2026 | Pending sale | $570,000$417/sqft |
Source: MoreMLS #22605056 Report a problem | ||
| 9/4/2026 | Price change | $570,000-0.9%$417/sqft |
Source: MoreMLS #22605056 Report a problem | ||
| 8/31/2026 | Price change | $575,000-2.5%$421/sqft |
Source: MoreMLS #22605056 Report a problem | ||
| 8/8/2026 | Listed for sale | $590,000$432/sqft |
Source: MoreMLS #22605056 Report a problem | ||
| 7/21/2026 | Pending sale | $590,000$432/sqft |
Source: MoreMLS #22605056 Report a problem | ||
| 7/13/2026 | Price change | $590,000-2.5%$432/sqft |
Source: MoreMLS #22605056 Report a problem | ||
| 6/24/2026 | Price change | $605,000-2.4%$443/sqft |
Source: MoreMLS #22605056 Report a problem | ||
| 6/7/2026 | Price change | $620,000-4.6%$454/sqft |
Source: MoreMLS #22605056 Report a problem | ||
| 6/1/2026 | Listed for sale | $650,000+1.6%$476/sqft |
Source: MoreMLS #22605056 Report a problem | ||
| 5/16/2026 | Listing removed | $639,999$469/sqft |
Source: MoreMLS #22605056 Report a problem | ||
| 5/16/2026 | Listed for sale | $639,999$469/sqft |
Source: MoreMLS #22605056 Report a problem | ||
| 3/16/2026 | Pending sale | $639,999$469/sqft |
Source: MoreMLS #22605056 Report a problem | ||
| 3/1/2026 | Listed for sale | $639,999$469/sqft |
Source: MoreMLS #22605056 Report a problem | ||
| Year | Property taxes | Tax assessment |
|---|---|---|
| 2025 | $8,302 +20.8% | $504,700 +20.8% |
| 2024 | $6,873 -3.9% | $417,800 +1.6% |
| 2023 | $7,148 +4% | $411,300 +12.7% |
| 2022 | $6,875 +9.7% | $365,100 +21.2% |
| 2021 | $6,267 -1.2% | $301,300 +0.2% |
| 2020 | $6,340 +6.3% | $300,600 +0.1% |
| 2019 | $5,966 | $300,200 +9% |
| 2018 | $5,966 +4.2% | $275,300 +3.6% |
| 2017 | $5,723 -0.1% | $265,700 +2.2% |
| 2016 | $5,729 0% | $260,000 +0.2% |
| 2015 | $5,730 +2.2% | $259,600 +2.5% |
| 2014 | $5,606 +1.5% | $253,200 |
| 2013 | $5,525 +1% | $253,200 |
| 2012 | $5,472 +0.4% | $253,200 |
| 2011 | $5,450 +3.9% | $253,200 -13.6% |
| 2010 | $5,248 -10.8% | $293,000 |
| 2009 | $5,883 | $293,000 +95.7% |
| 2008 | -- | $149,700 |
| 2007 | -- | $149,700 |
| 2006 | -- | $149,700 |
| 2005 | -- | $149,700 |
| 2003 | -- | $149,700 |
| 2002 | -- | $149,700 |
| 2001 | -- | $149,700 |

A local agent can set up tours, give advice and negotiate with sellers.
A local lender can help you make sure your offer is ready when you are.