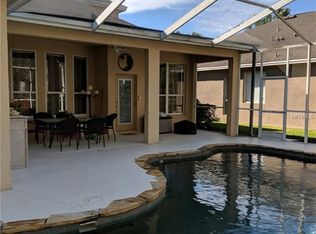
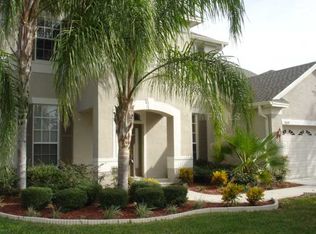
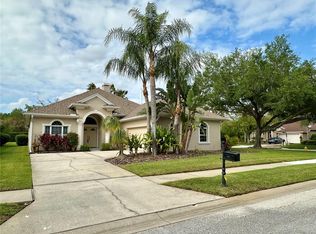
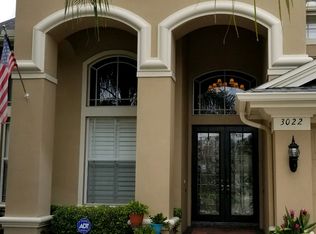
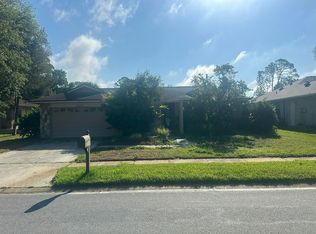
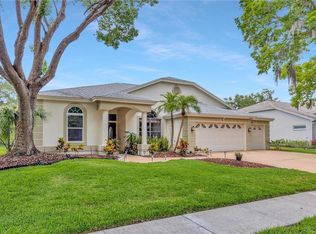
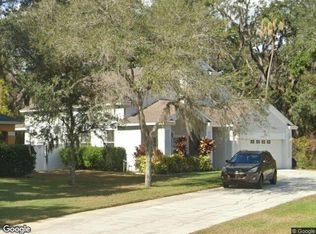
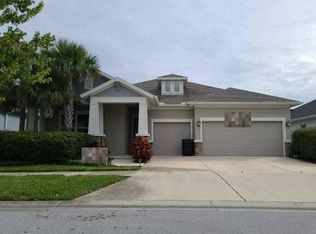
Beautifully updated Landsbrook home with open floor plan, designer touches throughout, gourmet kitchen with stainless steel appliances, granite counter tops and new fixtures. New carpet in bedrooms and new wood floors and travertine tile . Master bathroom has been updated with new tile and tile on garden tub surround and shower stall with new fixtures and dual sinks, second and half bath have been updated with same high end finishes . Pool overlooks pond and has new pavers and covered/screened enclosure that is perfect for entertaining. Owner is a Licensed FL Realtor. home is move in ready and offers all the amenities of Lansbrook and surrounding areas. Close to schools, shopping and beaches!!
Pre-foreclosure
Est. $714,000
3028 Northfield Dr, Tarpon Springs, FL 34688
4beds
2,943sqft
SingleFamily
Built in 2002
0.32 Acres Lot
$714,000 Zestimate®
$243/sqft
$112/mo HOA
Overview
- 206 days |
- 68 |
- 4 |
Facts & features
Interior
Bedrooms & bathrooms
- Bedrooms: 4
- Bathrooms: 3
- Full bathrooms: 2
- 1/2 bathrooms: 1
Heating
- Other
Cooling
- Central
Appliances
- Included: Dishwasher, Microwave, Range / Oven, Refrigerator
Features
- Flooring: Carpet, Laminate
Interior area
- Total interior livable area: 2,943 sqft
Property
Parking
- Parking features: Carport, Garage - Attached
Features
- Exterior features: Stucco
- Has spa: Yes
- Has view: Yes
- View description: Water
- Has water view: Yes
- Water view: Water
Lot
- Size: 0.32 Acres
Details
- Parcel number: 212716607280000340
Construction
Type & style
- Home type: SingleFamily
Materials
- masonry
- Foundation: Footing
- Roof: Composition
Condition
- Year built: 2002
Community & HOA
HOA
- Has HOA: Yes
- HOA fee: $112 monthly
Location
- Region: Tarpon Springs
Financial & listing details
- Price per square foot: $243/sqft
- Tax assessed value: $564,854
- Annual tax amount: $6,034
Visit our professional directory to find a foreclosure specialist in your area that can help with your home search.
Find a foreclosure agentForeclosure details
Estimated market value
$714,000
$671,000 - $757,000
$4,543/mo
Price history
Price history
| Date | Event | Price |
|---|---|---|
| 7/6/2016 | Sold | $415,000-1.2%$141/sqft |
Source: Public Record Report a problem | ||
| 5/8/2016 | Pending sale | $419,900$143/sqft |
Source: CHARLES RUTENBERG REALTY INC #U7759706 Report a problem | ||
| 5/8/2016 | Listed for sale | $419,900$143/sqft |
Source: CHARLES RUTENBERG REALTY INC #U7759706 Report a problem | ||
| 2/9/2016 | Listing removed | $419,900$143/sqft |
Source: CHARLES RUTENBERG REALTY INC #U7759706 Report a problem | ||
| 12/26/2015 | Pending sale | $419,900$143/sqft |
Source: CHARLES RUTENBERG REALTY INC #U7759706 Report a problem | ||
| 12/15/2015 | Listed for sale | $419,900+34.6%$143/sqft |
Source: CHARLES RUTENBERG REALTY INC #U7759706 Report a problem | ||
| 10/14/2015 | Sold | $312,000-19.8%$106/sqft |
Source: Public Record Report a problem | ||
| 7/5/2014 | Listing removed | $389,000$132/sqft |
Source: FLORIDA RELOCATION NETWORK,INC #T2613219 Report a problem | ||
| 6/7/2014 | Listed for sale | $389,000$132/sqft |
Source: FLORIDA RELOCATION NETWORK,INC #T2613219 Report a problem | ||
Public tax history
Public tax history
| Year | Property taxes | Tax assessment |
|---|---|---|
| 2024 | $6,034 +1.7% | $376,575 +3% |
| 2023 | $5,932 +2.7% | $365,607 +3% |
| 2022 | $5,774 -1.3% | $354,958 +3% |
| 2021 | $5,849 +0.2% | $344,619 +1.4% |
| 2020 | $5,839 +0.4% | $339,861 +1.2% |
| 2019 | $5,816 | $335,934 +0.6% |
| 2018 | $5,816 -0.2% | $334,014 +1.3% |
| 2017 | $5,827 -14% | $329,658 -0.4% |
| 2016 | $6,773 +7.7% | $330,833 +10.2% |
| 2015 | $6,291 +9.1% | $300,137 +9.8% |
| 2014 | $5,767 +32.6% | $273,402 +11.5% |
| 2013 | $4,348 +5.2% | $245,138 +1.7% |
| 2012 | $4,134 | $241,040 -9% |
| 2011 | -- | $264,966 -2.7% |
| 2010 | -- | $272,365 -8.3% |
| 2009 | -- | $297,054 +0.1% |
| 2008 | $5,033 | $296,757 +3% |
| 2007 | -- | $288,114 -10.6% |
| 2005 | -- | $322,200 +16.7% |
| 2004 | $5,213 +8.7% | $276,200 +12.7% |
| 2003 | $4,796 +419.9% | $245,000 +339.1% |
| 2002 | $923 | $55,800 +29.8% |
| 2001 | $923 | $43,000 |
Find assessor info on the county website
Monthly payment
Estimated monthly payment
All calculations are estimates and provided by Zillow, Inc. for informational purposes only. Actual amounts may vary.
HOA fees may include property taxes on listings classified as Co-Ops. Contact the listing agent and/or owner for fee details.
Mortgage interest rates are dependent on a number of factors, including credit score, down payment, and repayment length. Interest rate data provided by Zillow Group Marketplace, Inc. as of 1/1/1970 from various mortgage lenders with which we have lead or other similar arrangements; the Estimated Payment is an average of those rates.
See how much you could borrow to make a competitive offer.
Climate risks
Neighborhood: 34688
Nearby schools
GreatSchools rating
- 8/10Brooker Creek Elementary SchoolGrades: PK-5Distance: 0.8 mi
- 5/10Tarpon Springs Middle SchoolGrades: 6-8Distance: 5.4 mi
- 7/10East Lake High SchoolGrades: PK,9-12Distance: 0.2 mi


- Florida
- Pinellas County
- Palm Harbor
- 34688
- 3028 Northfield Dr
Nearby cities
Nearby zip codes
Other Palm Harbor Topics
