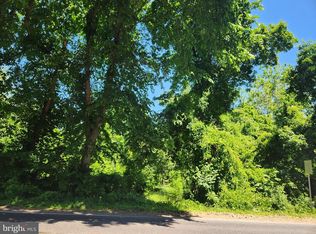
$722,300
-- bd-- ba1.8k sqft
75 Maplewood Ave, Cranbury, NJ 08512
Off Market
Zillow last checked:
Listing updated:
Patty Hogan 609-306-9189,
Keller Williams Premier

$776,900
$738,000 - $816,000
Not available
| Date | Event | Price |
|---|---|---|
| 2/1/2026 | Pending sale | $749,000 |
Source:  Bright MLS #NJMX2009866 Report a problem | ||
| 2/1/2026 | Listing removed | $4,500 |
Source: Bright MLS #NJMX2010572 Report a problem | ||
| 1/6/2026 | Contingent | $749,000+200.8% |
Source:  All Jersey MLS #2600308R Report a problem | ||
| 11/11/2025 | Listed for rent | $4,500 |
Source: Bright MLS #NJMX2010572 Report a problem | ||
| 11/11/2025 | Listing removed | $4,500 |
Source: All Jersey MLS #2605683R Report a problem | ||
| 11/3/2025 | Price change | $249,000-66.8% |
Source: Bright MLS #NJMX2010772 Report a problem | ||
| 10/20/2025 | Price change | $4,500-18.2% |
Source: All Jersey MLS #2605683R Report a problem | ||
| 10/9/2025 | Listed for rent | $5,500 |
Source: Bright MLS #NJMX2010572 Report a problem | ||
| 10/3/2025 | Price change | $749,000-2.1% |
Source: All Jersey MLS #2600308R Report a problem | ||
| 9/21/2025 | Price change | $765,000-1.3% |
Source: Bright MLS #NJMX2009866 Report a problem | ||
| 9/3/2025 | Price change | $775,000-2.5% |
Source: Bright MLS #NJMX2009866 Report a problem | ||
| 7/7/2025 | Listed for sale | $795,000+219.3% |
Source: All Jersey MLS #2514111R Report a problem | ||
| 6/20/2025 | Contingent | $249,000 |
Source: Bright MLS #NJMX2009428 Report a problem | ||
| 6/18/2025 | Price change | $249,000-17% |
Source: Bright MLS #NJMX2009428 Report a problem | ||
| 5/23/2025 | Listed for sale | $300,000-37.5% |
Source: Bright MLS #NJMX2009428 Report a problem | ||
| 12/16/2024 | Sold | $480,000+20% |
Source: All Jersey MLS #2505673R Report a problem | ||
| 11/15/2024 | Contingent | $400,000 |
Source: All Jersey MLS #2505673R Report a problem | ||
| 11/15/2024 | Pending sale | $400,000 |
Source: Bright MLS #NJMX2007972 Report a problem | ||
| 11/6/2024 | Contingent | $400,000 |
Source: Bright MLS #NJMX2007972 Report a problem | ||
| 11/4/2024 | Listed for sale | $400,000 |
Source: Bright MLS #NJMX2007972 Report a problem | ||
| 11/4/2024 | Contingent | $400,000 |
Source: Bright MLS #NJMX2007972 Report a problem | ||
| 10/29/2024 | Listed for sale | $400,000 |
Source: Bright MLS #NJMX2007972 Report a problem | ||
| Year | Property taxes | Tax assessment |
|---|---|---|
| 2025 | $7,947 | $433,300 |
| 2024 | $7,947 +1.4% | $433,300 |
| 2023 | $7,834 +1.5% | $433,300 |
| 2022 | $7,721 -0.4% | $433,300 |
| 2021 | $7,752 | $433,300 |
| 2020 | -- | $433,300 |
| 2019 | $8,532 +3.2% | $433,300 |
| 2018 | $8,263 -1.3% | $433,300 |
| 2017 | $8,376 +1.8% | $433,300 |
| 2016 | $8,224 -0.4% | $433,300 |
| 2015 | $8,254 +4% | $433,300 |
| 2014 | $7,938 -0.1% | $433,300 |
| 2013 | $7,947 +5.5% | $433,300 |
| 2012 | $7,531 +6.2% | $433,300 |
| 2011 | $7,093 +2.1% | $433,300 |
| 2010 | $6,946 -1.1% | $433,300 |
| 2009 | $7,020 | $433,300 -5.3% |
| 2008 | -- | $457,600 |
| 2007 | -- | $457,600 +230.9% |
| 2006 | -- | $138,300 |
| 2005 | -- | $138,300 |
| 2004 | $5,062 | $138,300 |
| 2003 | -- | $138,300 |
| 2002 | -- | $138,300 |
| 2001 | -- | $138,300 |
Source: Bright MLS. This data may not be complete. We recommend contacting the local school district to confirm school assignments for this home.

A local agent can set up tours, give advice and negotiate with sellers.
A local lender can help you make sure your offer is ready when you are.